5v5 offense and defense, quality shots vs quantity shots (data as of Dec 18 – xG via Moneypuck)
December 19, 2023
5v5 offense and defense, quality shots vs quantity shots (data as of Dec 18 – xG via Moneypuck)
6 comments
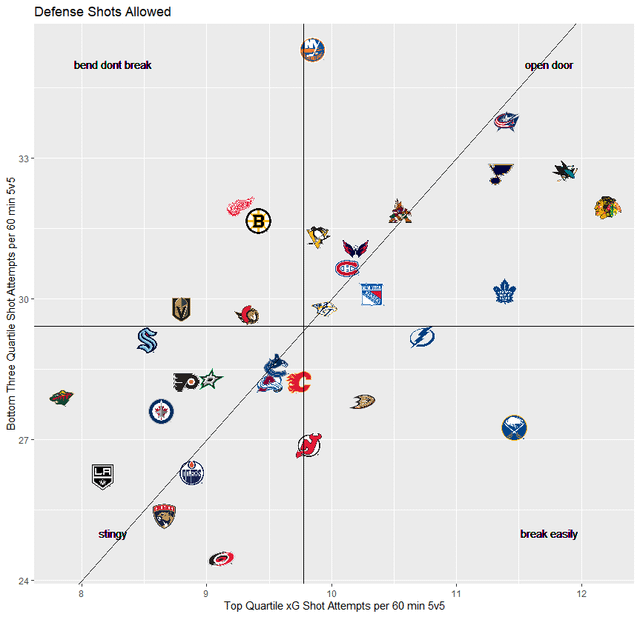
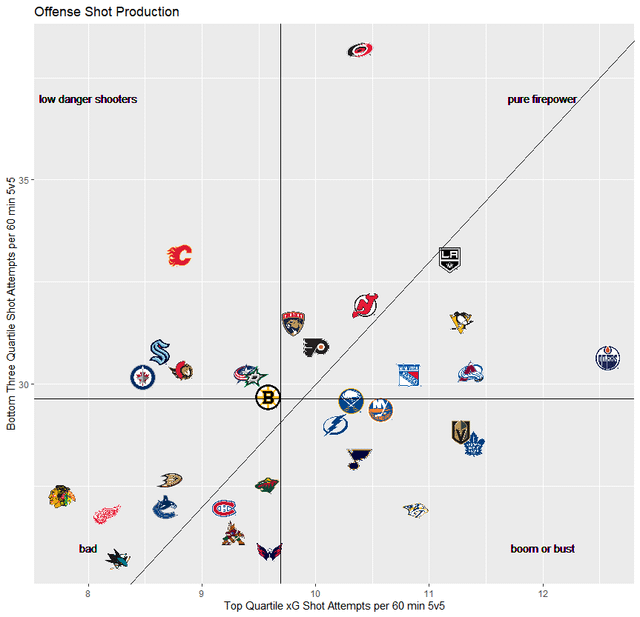
hey everyone im finally back with an update! i’ve worked on my data source so i am much more responsive – as such, this is data on games played up to and including Dec 18, 2023. i’ve additionally switched the xG calculation from hockeyR to the more well established Moneypuck xGoal.
I also added the diagonal line that represents the top quartile vs bottom 3 quartiles divide – if you’re a perfectly regular team, you’ll give up/take 1 top quartile shot for every 3 bottom three shots. if you’re to the right of the diagonal line, you give up/take dangerous shots at a higher proportion than the league and if you’re to the left of the diagonal, then you’re more quantity than quality.
Moneypuck saying Edmonton has good defense just stop
It makes me nervous that basically every underlying stat says the bruins are a mediocre team being propped up by excellent goaltending.
Carolina loves their low danger shots
Awesome graph!
Can someone explain this graph to the people who don’t understand the stats lingo

6 comments
hey everyone im finally back with an update! i’ve worked on my data source so i am much more responsive – as such, this is data on games played up to and including Dec 18, 2023. i’ve additionally switched the xG calculation from hockeyR to the more well established Moneypuck xGoal.
I also added the diagonal line that represents the top quartile vs bottom 3 quartiles divide – if you’re a perfectly regular team, you’ll give up/take 1 top quartile shot for every 3 bottom three shots. if you’re to the right of the diagonal line, you give up/take dangerous shots at a higher proportion than the league and if you’re to the left of the diagonal, then you’re more quantity than quality.
Moneypuck saying Edmonton has good defense just stop
It makes me nervous that basically every underlying stat says the bruins are a mediocre team being propped up by excellent goaltending.
Carolina loves their low danger shots
Awesome graph!
Can someone explain this graph to the people who don’t understand the stats lingo