
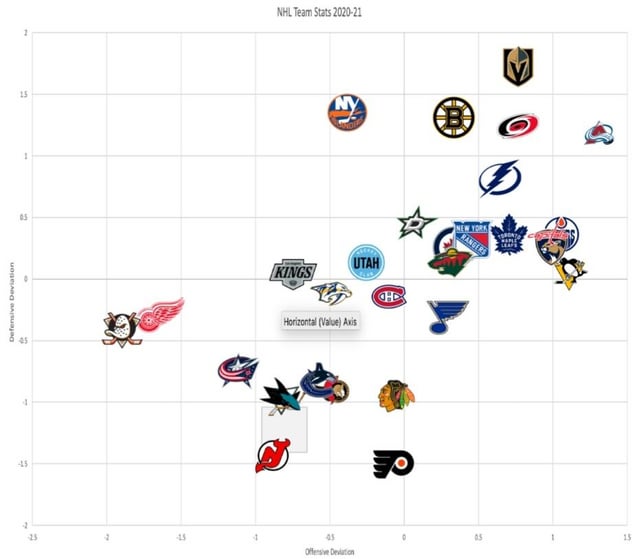
Disclaimer:I posted the post quarantine 21-24 stats before in this sub. I also used the jets and current utah logo to represent the coyotes and thrashers in some of these. As for the 2020-21 post the sabre logo didn't come out well and so the Grey square is where Buffalo should be.
I will also be doing monthly or so update charts of the teams throughout the 2024-25 season roughly(school and work may get in the way somewhat).
19 comments
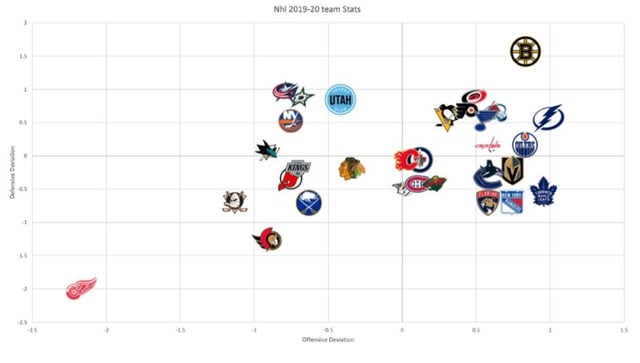
I thought the 2019-20 stats forgot Detroit…… then I clicked on it. Oof.
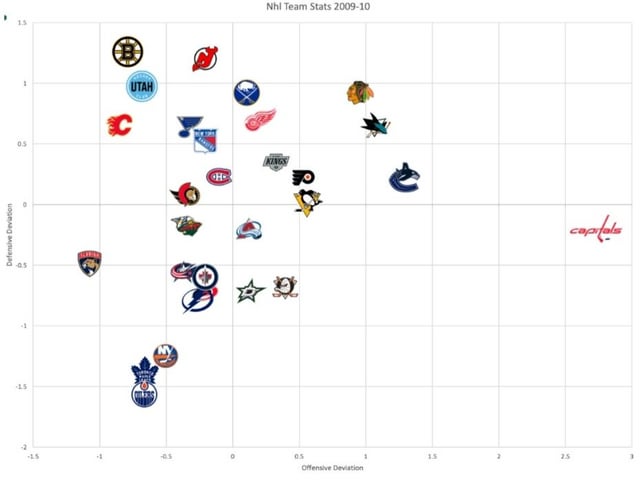
That 09-10 team was so much fun. Fucking Halak.
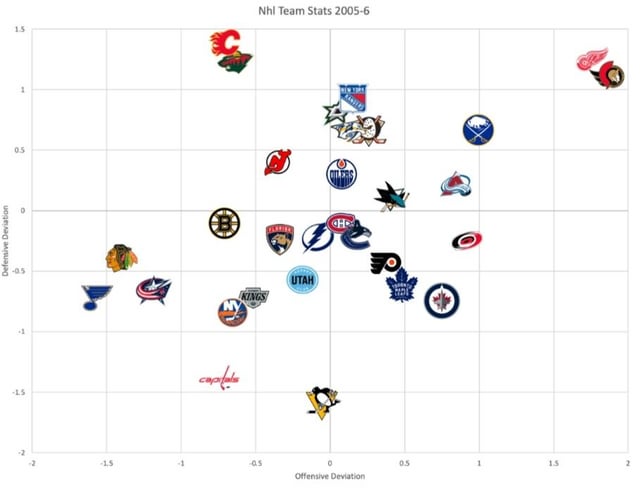
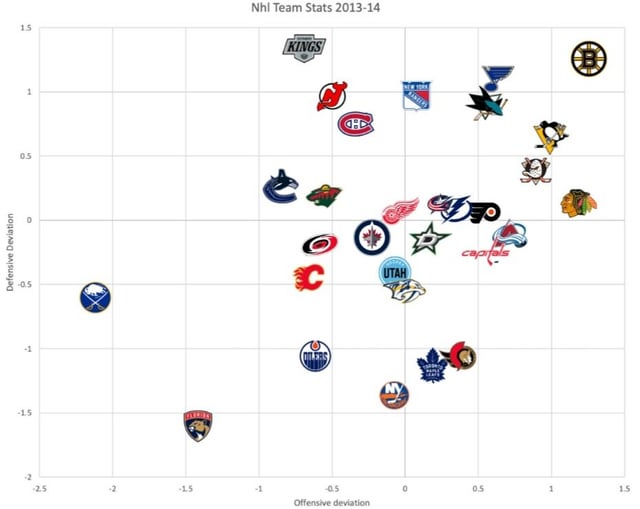
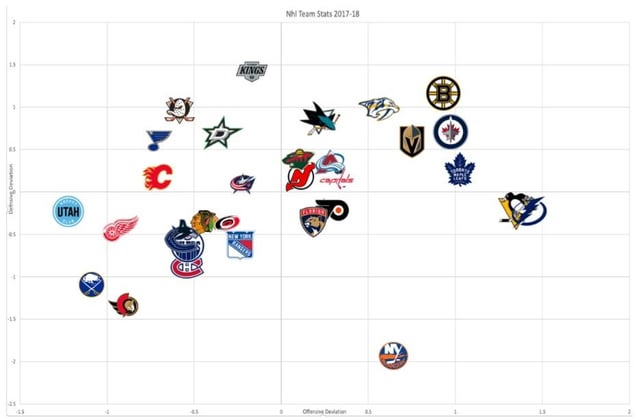
And of course Calgary appears in the dead fucking center of this graph multiple times, and has like two good outliers and two bad outliers.
Shocked. Shocked I say.
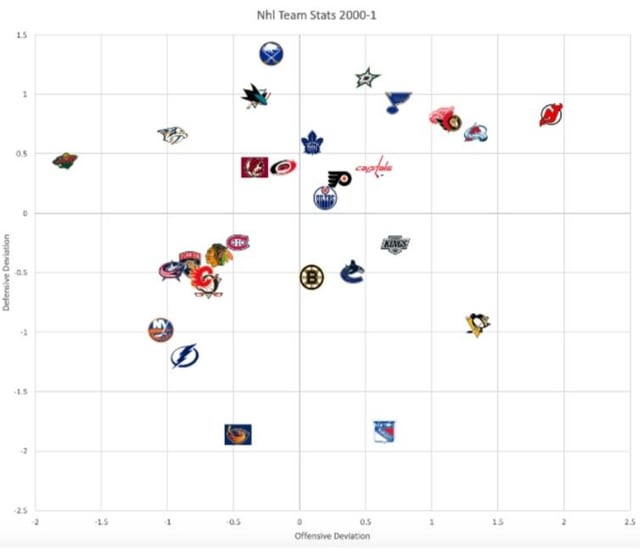
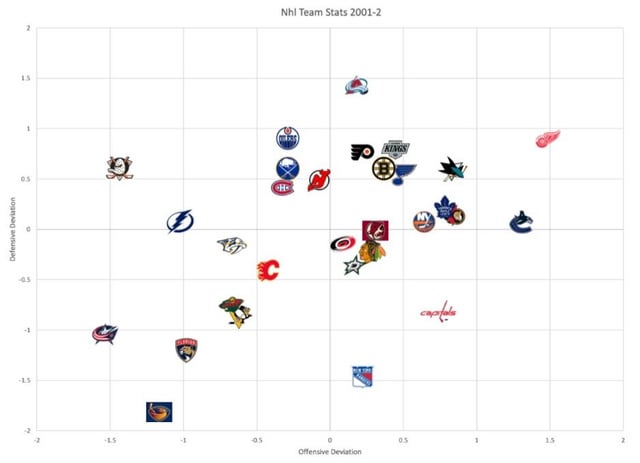
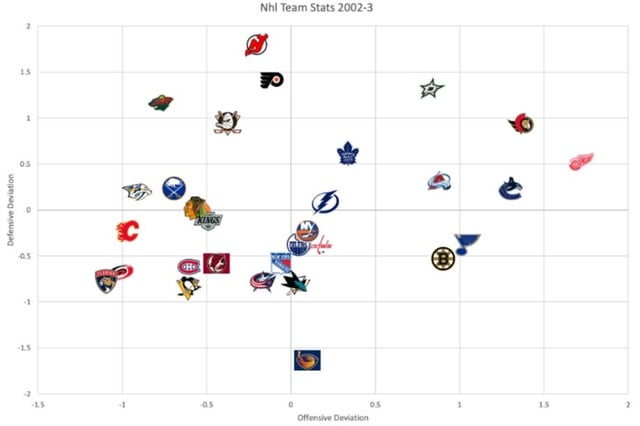
Those 2000s Detroit teams were something else. Damn
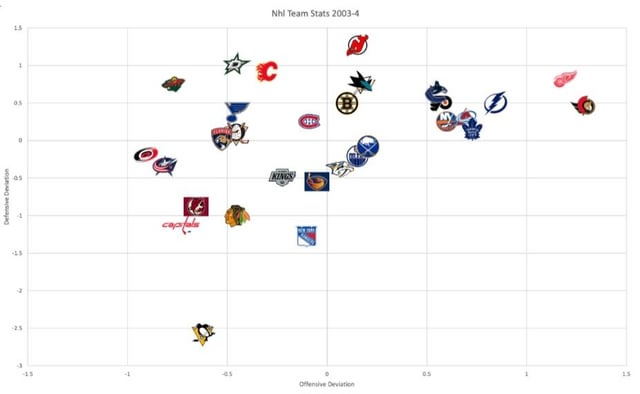
Honestly surprised the 01-04 Pens weren’t even lower. They were so unbearably bad.
09-10 Caps jesus
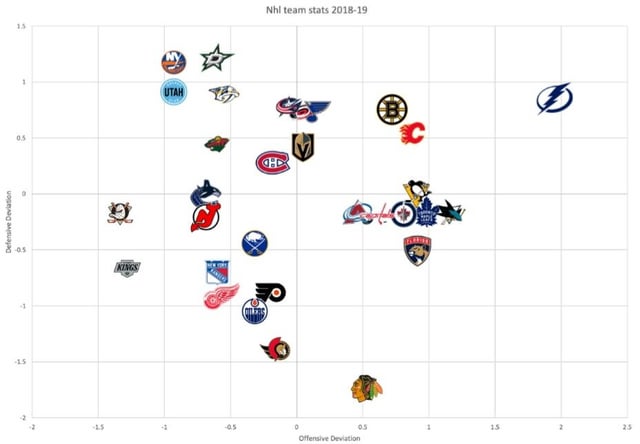
18-19 chaos squad just chillin together
Source?
Thanks for keeping the OG mighty ducks logo throughout… WISH THE TEAM DID
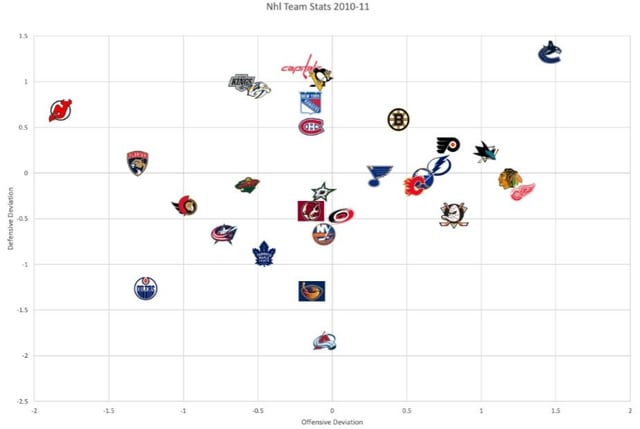
Only one year, 2010/2011, where a team was 1st in both offense and defence. The Canucks.
Fascinating.
that 10/11 canucks team… so dominant for 82 games and 3.5 series. best team in history to not win a cup
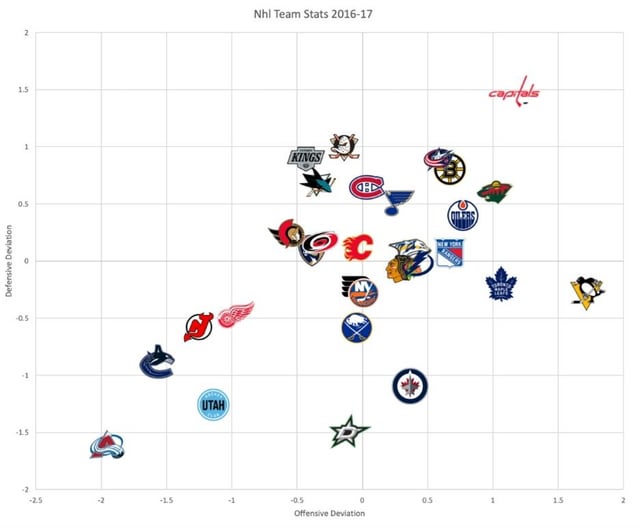
Uhhh, you guys have a year in there that I don’t remember. What is this “16-17 year” you speak of???
How about Utah making its first appearance in 05-06
God damn what a turnaround we had from 17-18 to 18-19.
Wow the Islanders sure blew ass from 2007-2015. Surely their rebuild and success afterwards made up for the suffering though!!
That 16-17 CBJ team was nasty. That was the big upset year of Tampa. Fun team, lotta talent. Shame it broke up immediately.
We don’t talk about that 16/17 season.
This should explain my constant state of disappointment to my non-hockey friends
Why do the Thrashers turn into the Jets in 2005-2006?