

In a league built on parity, the NHL salary cap is designed to give every team an equal shot at success. But one structural factor quietly shifts the playing field: income tax.
Players don’t negotiate based on gross salary—they care about take-home pay. Teams in no-income-tax states like Florida, Texas, and Nevada can offer identical contracts to high-tax teams while delivering significantly more net income. That difference accumulates over time and influences where players choose to sign and stay.
Interpreting the Graph
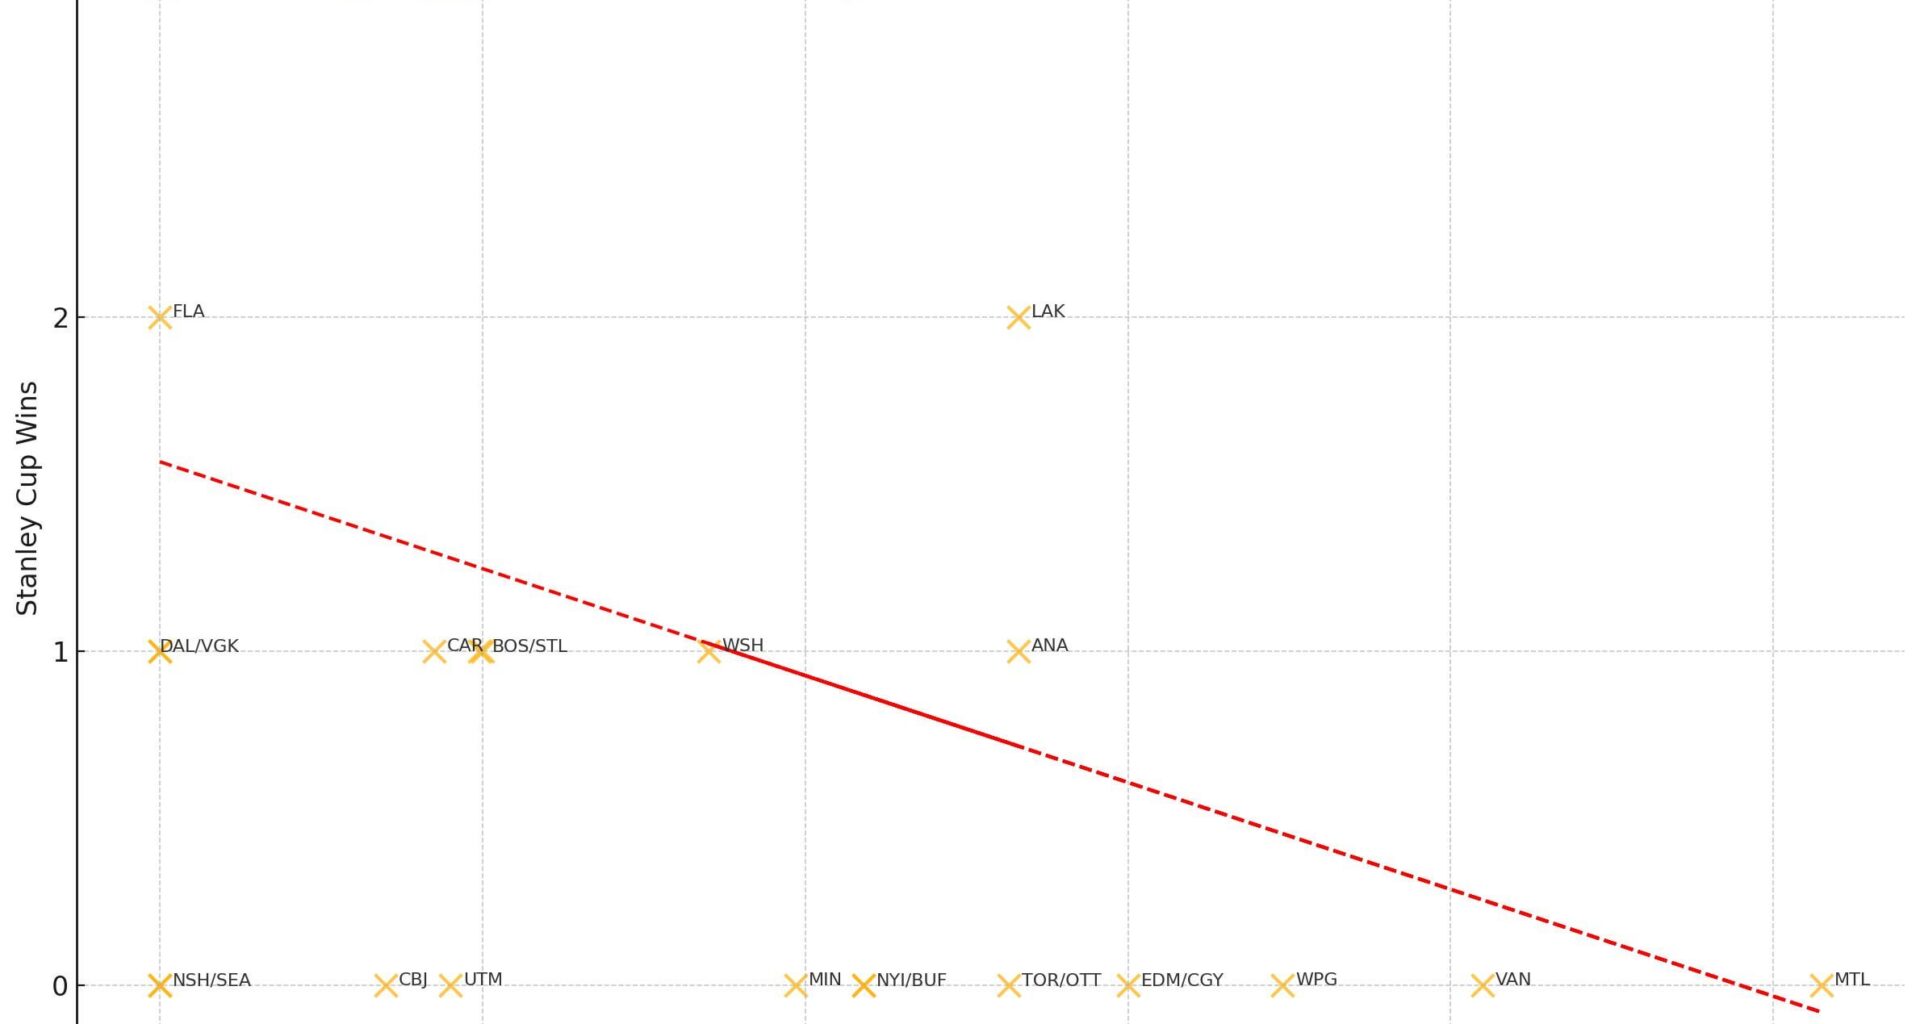
The scatter plot visualizes the number of Stanley Cup wins from 1995 to 2025 for each NHL team, plotted against the state or provincial income tax rate in their location. Each point represents a team or group of teams, and the y-axis shows how many Cups they've won during that period.
The red dashed line is a linear regression line, showing the general trend: as income tax rates increase, the average number of Stanley Cup wins decreases. This suggests a negative correlation between tax burden and championship success.
While not every low-tax team wins and not every high-tax team loses, the trend line reveals that—on average—teams in low-tax jurisdictions have more on-ice success. For example, Florida teams with 0% tax have won 6 Cups since 2004, while no Canadian team in a high-tax province has won in the same timeframe.
The trend line offers a visual and statistical summary of the argument: tax policy, though not counted in the cap, clearly shapes where players sign and how teams sustain success.
League and Player Perspectives
Even NHL Commissioner Gary Bettman has addressed the tax question, stating in June, 2025:
"It’s a ridiculous issue. When the Florida teams weren’t good, which was for about 17 years, nobody said anything about it. For those of you that played, were you sitting there with a tax table? No. You wanted to go to a good organization…with a coach you were comfortable with. Could it be a little bit of a factor? If everything else were equal? I suppose. But that’s not it."
Still, some voices remain more direct:
"There is a distinct advantage for those teams that are in states with no tax — always,” says tax specialist Alan Pogroszewski.
On the player side, former Bruin Brad Marchand (who later joined Florida) adds:
"When you look at a team like Montreal…52 or 54 %? Versus a team like here or Dallas…That’s a 15 % difference… When you add that up, it’s a tremendous amount of money.”
Conclusion
In a capped system where every dollar counts—especially on mid- and lower-tier contracts—paying players becomes significantly more efficient in tax-neutral jurisdictions. This isn’t conjecture; it’s affirmed by league officials, tax experts, and players themselves.
While the NHL maintains that “there’s so many variables” beyond taxes, the data and voices suggest otherwise: tax policy is an economic lever that quietly but materially influences competitiveness.
16 comments
Don’t you have to have some sort of regression coefficient to show how strong the link is? I think without it, we can’t know how seriously to take the line. This looks like it might be rather weak correlation.
Might wanna use something more common than a Stanley Cup win
Reg season wins, Playoff wins or anything else really
Cup wins are “random” and 1/30 or 32 now is very uncommon in even a very good team with a big advantage might not ever win
It’s not a NHL problem, it’s a city/state issue. If you want lower taxes in favor for your sports team, well then get something passed locally to change it. It’s funny how people bring it up now in the NHL because Florida is dominating hockey. I don’t see any other sports crying about it as a major issue, and those players are getting heck of a lot more than these NHL players are.
Take the 2011 and 2024 Cup Finals and reverse the Game 7 results.
If you flip EDM for FLA and VAN for BOS, does your result still hold? This looks like some weak correlation, particularly if the outcome of 2 60-minute games can change the result that much.
I think this is still an open question with evidence on both sides. Don’t forget that each jurisdiction applies its own “jock tax” for income earned in each away game, reducing the effect.
[Evidence for big impact](https://users.ssc.wisc.edu/~hembre/wp-content/uploads/2019/12/TaxesTeamPerformance_EE_All_Revisions.pdf)
[Evidence for small impact](https://economics.yale.edu/sites/default/files/2023-01/Giraldo%20Daniel%20Senior%20Essay%20Final.pdf)
For years Florida absolutely sucked. They just got lucky getting a great coach and GM. Players enjoy playing for them. Sure the low tax rate helps, but if the players hated the coach or GM, they would leave.
My guy, idk what experience you have with statistics, but that trend line is….woof
And there is a correlation between sun tans and Stanley Cup wins. Maybe increasing time in sun beds will increase Stanley Cup wins.
It is prob cheaper living in Winnipeg making 5 mil USD then living in a city like Dallas making 5 mil USD even after taxes? And only half your income is taxed in your home province I believe since half your income is taxed during away games in those areas? NHL layers must have very good accountants lol
Fun fact: there’s a positive relationship with having smaller forwards and winning in the playoffs. Doesn’t mean getting smaller is better.
Now that said, income tax is an advantage while I’m unsure being smaller for forwards is.
I have a few issues with this analysis, even though I know that income tax matters.
I will say that income tax is only one factor of many that matters.
Ekblad gave about 4x the discount that we’d project based of market expectations and tax savings. Do you think he’d give that same discount to Seattle right now where he’d have the same tax implication?
Mangiapane reportedly did not take the best offer $ wise with going to EDM because he wants a shot at playing with one of McDavid or Draisaitl and thinks he can win there.
Etc etc.
Taxes matter but I also want to point out that take home pay is still VERY different than what you see just looking at income taxes for players, discretionary income is different than take home pay, and the value of that dollar will also differ everywhere with buying power.
Finally there’s a lot of muddying in confounding variables. Many of the tax free cities are in warm, tourist friendly, fun, cities. You can be grabbing the impact of both things when you look at isolating just taxes.
It takes skill and teamwork to win a cup, not after tax earnings. You should do the exact same table but by MVP candidates by location against tax rate. Do it by goals scored by team versus tax rate. Correlation doesn’t always equal causation.
This argument is so exhausted for so many reasons. Isaac howard was drafted by TBL, a no income tax team, and DEMANDED to be traded. He’s now an oiler, and chose to leave Tampa completely of his own free will.
That, plus the fact that between 1993 and 2022 the cats SUCKED. Last season, the predators SUCKED.
Please for heavens sake find a different way to cope about Canadian teams not winning cups.
What’s the R^2 here?
Theres a couple things that really get in the way of this data really bearing any significance in its current form. just a couple off the top of my head are:
-Some states have flat tax rates, some states have variable tax rates. Some states with variable tax rates have their max cap(what you used, it looks like) at 100k some at 1m etc. That all effects how much take home pay would be. It should probably be like… take home pay on the median NHL salary calculated against each marginal tax rate. (given then you get into questions of whether a star player, who takes a bigger cut out of the top bracket would have any effect on your data since its part of the argument you are trying to make, vs. the 2.5m median salary. e.x. Median player in a state where the top cap is 1m will have 1.5m taken out on top rate, where someone like McDavid would have 11.5 out of 12.5m taken out at top rate.(and heck for some places like Quebec, it is
-There is really not a lot of data to work here with a y axis of 3 possible values and only 30 possible outcomes that are covering the data.
-You probably need to do a marginal Cups/Year as a Y axis if you want to use Cups, as some teams, like VGK have a much higher Cups per Year than a team like the Panthers.
-How would teams like the Jets get calculated where they have half of your timeframe in a different tax zone?
-How would cost of living throw a wrench in this data? It costs a lot more to live in Dallas than it does to live in St. Louis(the difference is greater than most of the tax rates, given life is different when you are on a median 2.5m salary)
I would say be very careful using inflammatory statements like “the data and voices suggest otherwise” when theres a lot in the data that can be further ironed out here. as far as the Y axis, Personally I agree with the person saying game wins may be a good statistic, playoff wins or playoff appearances, or perhaps average placement in league standings across their time(given things change so that would have to be figured out). Anything to make the data more consistent. And then on the X axis I would definitely look at ironing out a more consistent method to get an equal ranking across the board, as top tax rate alone leaves a decent bit to be desired with all the other parameters that go into it.
And as an aside, it may be important to add other sports teams into this equation, hockey is one thing, but states like Mass dont really have a low tax rate when it comes to professional sports due to the 5% surcharge above 1m, but dominate most sports due to their boston teams. Where states like florida have shit all going for them in multiple sports (that arent hockey specifically)
This got shared on the leafs sub, so as a fan of another high tax rate team, I come in piece and drop the same comment I did there.
Here is a breakdown of the league by net income tax as calculated by the athletic [here](https://www.reddit.com/r/hockey/comments/1ezlcjf/the_athletic_teams_sorted_by_tax_rate_and_number/#lightbox)
Split the league into 3rds, 11 teams with over 49% tax rate, and 10 teams in the middle, 11 teams under 42.5% effective tax rate.
Since the cap started 19 seasons ago there have been 38 finals appearances.
6/38 (15.8%) by the high tax 3rd of the league
12/38 (31.6%) by the medium tax 3rd of the leauge
20/38 (52.6%) by the low tax 3rd of the league.
This is why the discussion is starting to gain some traction. The difference between the high tax and low tax parts of the league is starting to look suspiciously far from ~33% you might expect with perfect parity.
Using [puckpedia home tax rates](https://puckpedia.com/tax-calculator) for $8m/season. PT means Presidents’ Trophy…
https://preview.redd.it/tvg5gncz5adf1.jpeg?width=1179&format=pjpg&auto=webp&s=a7ff6d414fe6c3a0ae25ff47913e89d841b5b66a