
Visiting Habs fan here! I built a tool to create these cumulative performance charts and decided to make one for every NHL team before the start of the season.
I originally created this for my baseball team, the Pirates, who hit a franchise milestone this season – reaching exactly .500 (10,879-10,879) on July 19th for the first time since 1903. I wanted to visualize the incredible downward spiral back to 0.500 (for those interested: Pirates chart), and it turned out so compelling that I decided to bring the concept to my second favorite sport: hockey.
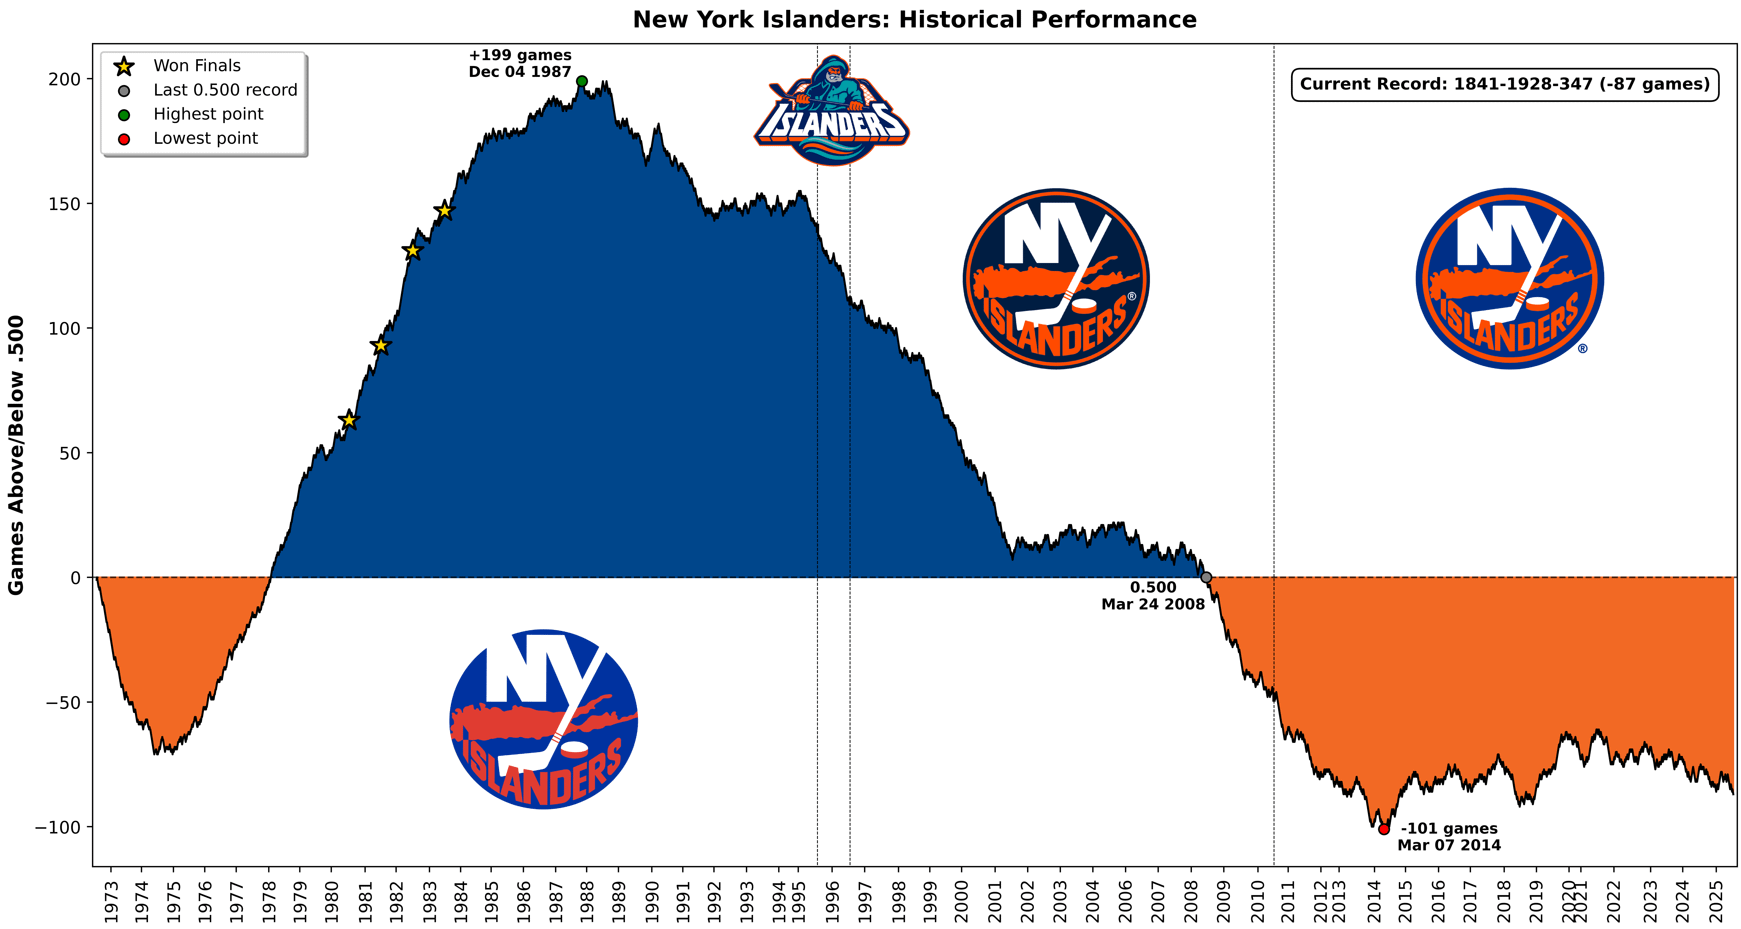
Technical note: Each win (regulation or OT) moves the line up +1, each loss (regulation or OT) moves it down -1, and ties keep the value unchanged. The dotted line shows a logo change (I decided to ignore the more subtle logo changes).
6 comments
Post fisherman years…yikes
The dynasty was so damn good. I wish I was around to see it.
You can see the impact Lou immediately had, and then how it tapered out at the end of/post Trotz
Let’s Get Back in the Blue!
Not sure that I agree that shootout and overtime losses should be counted as regular losses. This wasn’t something that existed for the half of their existence and it’s a forced outcome.
Their overall record is: 1841-1715-347-213 which to me is over .500 (and it is over .500 in points %)
This is really cool, but unfortunately I think that orange gets a bit deeper well before the isles ever enter the blue territory again.