
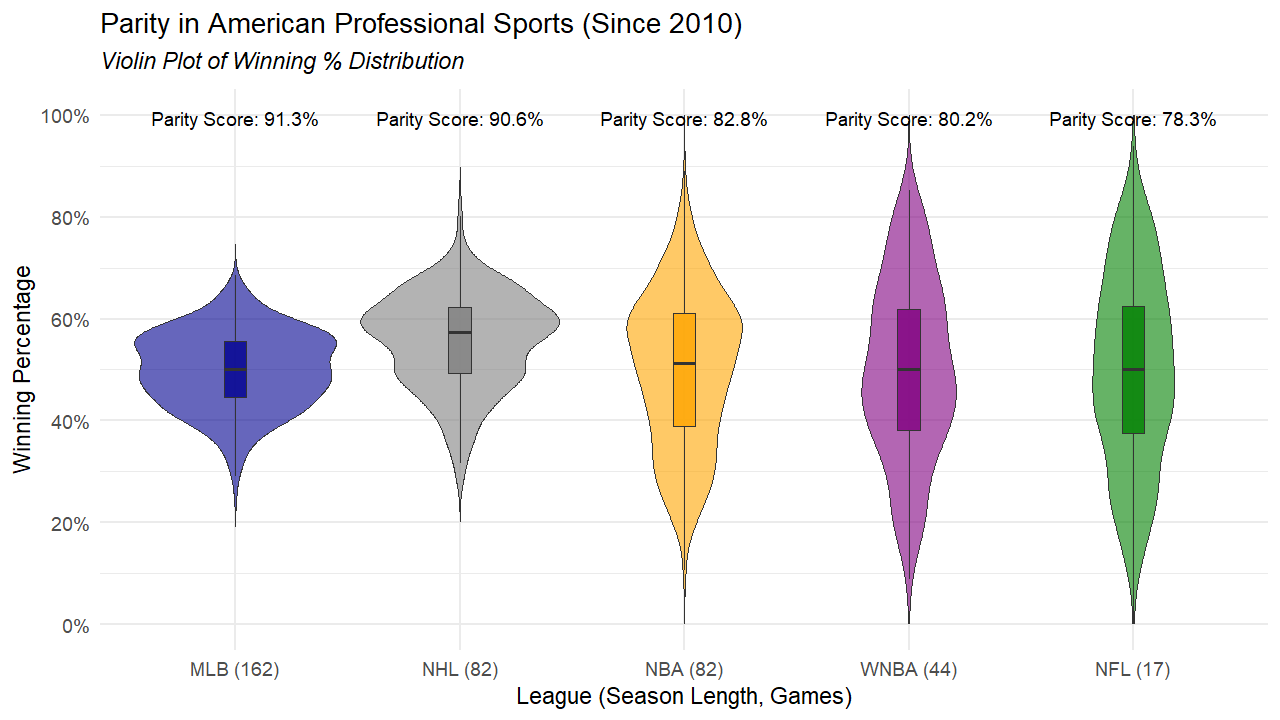
I did a project to study parity across the major sports leagues in America, with my hypothesis that MLB actually had the most parity of any league. This doesn't necessarily mean that different teams are good every year, it just means that the best teams aren't that dominant and the worst teams aren't that bad when compared to other leagues.
I looked at the winning percentage of every team-season since 2010 and created a violin plot to visualize it. The more round the plot, the better the parity and more regular the distribution. The parity score was calculated using the Gini coefficient (G), where Parity Score = 1 – G. A parity score of 100% would mean every team has a 0.500 winning percentage every year.
32 comments
Does the female form make you uncomfortable, Mr. Lebowski?
I should call her.
[deleted]
Ain’t no way
I can believe this. What I would be curious about is if you do the same style of chart showing team salary (adjusted for the value of a dollar in 2025).
Surprised this doesn’t show the mls. They should have great parity
Everything makes me think of her…
Did you adjust for length of schedule?
Rather, how much of the standings closeness is the result of a schedule long enough to cancel out shorter hot and cold streaks?
This is not the right measure of parity. Parity should be measured in the distribution of playoff appearances and playoff success.
If you took a 17 game snapshot of the mlb it would look similar to the NFL. This is a difficult hypothesis to prove with winning percentage.
If there’s so much parity, then why is the cellar the only thing I’ve ever known?
Parity isn’t the right word for this.
I’m not sure what is, but you aren’t describing parity.
I’ve always thought of it in a different way based on the nature of the game itself. In the NFL, the better team almost always wins. In the NBA, the better team usually wins. In MLB the better team wins a majority of the time. It’s one reason they play the number of games they do. It only takes 17 games to separate the good vs bad teams in football. It takes more in basketball. And it takes a ton in baseball.
Higher scoring contests tend to produce results closer to the expected result. This is why NBA records vary from 73-9 all the way down to 9-73.
I’m pretty sure I used to date the one in the middle.

Would it be any different if you chose random 17-game windows of the non-NFL leagues so we can compare identical “season” length?
Tom Brady single handily throwing off the NFL parity score
Georgia O’Keefe would be proud of you
interesting graph…
yes, the sport that plays 162 games will more records closer to 500 than the sport that plays 17
Oh THAT’S what this graph shows
Yeah number 3. That’s my girl.
All graphs are beautiful.. but that said, I’m a fan of number 4.
Everything reminds me of her
this really needs to be adjusted for the underlying randomness of the sport. baseball and hockey are more random than the other sports by default, so i just think this is picking up “baseball is more random than football, given skill differences”.
Baseball is longer and more random so the highest and lowest winning percentages are naturally closer together, that’s why it’s ordered from most to least games played. MLB doesn’t have financial parity
Love a ggplot
I throw the red flag 🚩 Without a cap, even a soft one, I’d argue it’s among the worst.
Every runner competing against Usain Bolt was within 1/50th of a second slower, 99.9% as fast, but that didn’t mean they had competitive parity. Win-loss record isn’t a measure of parity. Take the NFL for example. Because the season is only 17 games, one game difference is 6%. That’s the flaw of your thesis.
MLB has the longest season. As Yogi Berra said, every team will win 60 and lose 60, it’s what you do with the other 42 games that matter.
Good color choice for WNBA. Parity looks amazing lol
Uhhhhhhhmmmm…..these look familiar.
Ain’t no way I’m this down bad 😭
Incredible jerk potential here. Quick, somebody from the circle jerk sub do something with this.