In before someone says “actually second and third round picks have a negative hit rate” or whatever
Poles is trash. There is no way around it
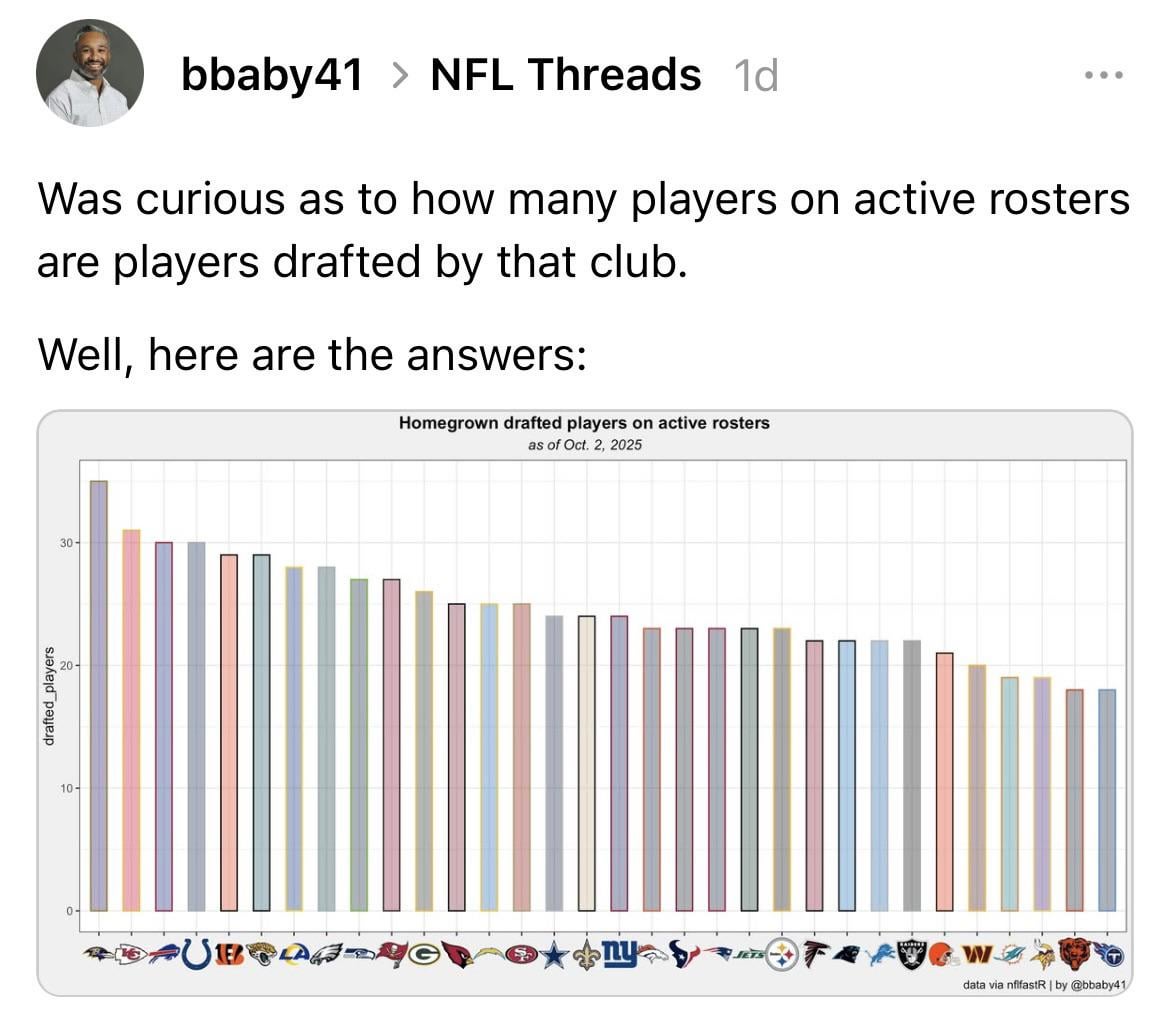
So the average is about 24 and the bears are at 18. At least if I’m interpreting the bars correctly.
Direct correlation to winning teams. The real question is were they bad draft picks by the GM or did we not have the coaches on staff to develop players?
I mean we just haven’t had many picks recently?
2024 was 2 top 10’s and mid-late picks. 2022 poles first year was a couple 2nds a third and a shit ton of super late picks.
Pretty much all of Poles picks have survived. I’m not that surprised by this
Also note if your team has a QB on a big contract, you can’t afford as many FAs so you HAVE to play draft picks
I’d be interesting in seeing how many of each team’s draft picks are still in the league *at all*.
so if you hit on your picks you win more. yeah that tracks.
There’s good and bad teams all over this graphic. Don’t read too much into it.
Rage bait the Poles haters.
Winning teams have consistency, and losing teams do not. Any new GM is going to replace players with their own. Do we want Fields, Jenkins and Herbert back on the team to improve this stat?
Is part of the problem hiring terrible coaches that haven’t developed anyone we’ve drafted?
More important is how many players drafted are still on the league
Is this poles’ famous building through the draft I’ve heard so much about
Poles hasn’t been good but I think people forget that most players the Bears have drafted over the last 15 years aren’t on a team. Eddie Goldman is the only players prior to 2016 that’s on an nfl roster. From 2015-2019 theres 10 players still on nfl rosters but none are still with the Bears.
Bears have 2 players from the 2020 draft and none from 2021. The remaining 16 players were drafted by poles between 2022-2024. This graph reflect poor drafting by pace more than it does poles.
It’s also important to point out that simply being on the roster of a bottom feeding team is not as impressive as being on the roster of a perennial contender.
So not only do the Bears have the 2nd fewest draft picks that make the team, they do so while also having been a 5 win team year after year after year. Basically Poles drafting is so bad that his picks can’t even beat out the starters on our team that would be backups or 3rd stringers on real teams.
Wouldn’t a percentage of players drafted to still on team be better than raw #?
Not sure what’s happening here, but this is incorrect. The Bears have 26 drafted players still on the team.
*edit – alright I have no idea how to do tables on reddit anymore. I swear I once had the power. Those days are… gone
There is a trend here 🤔
What is the data normalization strategy here? Do we include # of picks? Do we include a variance based on round? Do we weigh anywhere? Is this just a raw number?
What I want to see is what percentage of bears draft picks went on to get a second contract. With the bears or elsewhere. Who’s still in the league. Not just with the bears.
Roughly 50% of all 1st round picks are even offered a second contract. Far less for subsequent rounds.
Above a 50% hit rate (second contract or better) is amazing. Below, about 40% is bad.
40%-50% is the average, if I remember correctly.
– “a 2023 analysis found that only about 44% of first-round picks from 2011-2020 signed a second contract with their original team, indicating a high turnover rate even for highly-touted players.”
Edit: The above quote is from Google and only applies to firsts. So, about 35% of all rounds would be considered average. Anything above that is good. Anything below that is bad.
two of the bottom 7 won 14 and 15 games each last year
not sure what we can exactly extrapolate from this
There’s a lot more questions, although fascinating to see an obvious correlation to wins/losses. Rookie contract QB’s would logically tend to skew the data to FA signings. Also, understanding who the current GM has under their watch on the active roster vs previous regimes. Then do a year over year comparison of those points to see if you are above or below the net trend.
Also, go Bears.
I mean as long as we are building through the draft. Curious what the date range of this data population is though. Also curious as to what the stats look like for the past 3 or 4 years.

24 comments
In before someone says “actually second and third round picks have a negative hit rate” or whatever
Poles is trash. There is no way around it
So the average is about 24 and the bears are at 18. At least if I’m interpreting the bars correctly.
Direct correlation to winning teams. The real question is were they bad draft picks by the GM or did we not have the coaches on staff to develop players?
I mean we just haven’t had many picks recently?
2024 was 2 top 10’s and mid-late picks. 2022 poles first year was a couple 2nds a third and a shit ton of super late picks.
Pretty much all of Poles picks have survived. I’m not that surprised by this
Also note if your team has a QB on a big contract, you can’t afford as many FAs so you HAVE to play draft picks
I’d be interesting in seeing how many of each team’s draft picks are still in the league *at all*.
so if you hit on your picks you win more. yeah that tracks.
There’s good and bad teams all over this graphic. Don’t read too much into it.
Rage bait the Poles haters.
Winning teams have consistency, and losing teams do not. Any new GM is going to replace players with their own. Do we want Fields, Jenkins and Herbert back on the team to improve this stat?
Is part of the problem hiring terrible coaches that haven’t developed anyone we’ve drafted?
More important is how many players drafted are still on the league
Is this poles’ famous building through the draft I’ve heard so much about
https://i.redd.it/txdsckkhczsf1.gif
Poles hasn’t been good but I think people forget that most players the Bears have drafted over the last 15 years aren’t on a team. Eddie Goldman is the only players prior to 2016 that’s on an nfl roster. From 2015-2019 theres 10 players still on nfl rosters but none are still with the Bears.
Bears have 2 players from the 2020 draft and none from 2021. The remaining 16 players were drafted by poles between 2022-2024. This graph reflect poor drafting by pace more than it does poles.
It’s also important to point out that simply being on the roster of a bottom feeding team is not as impressive as being on the roster of a perennial contender.
So not only do the Bears have the 2nd fewest draft picks that make the team, they do so while also having been a 5 win team year after year after year. Basically Poles drafting is so bad that his picks can’t even beat out the starters on our team that would be backups or 3rd stringers on real teams.
Wouldn’t a percentage of players drafted to still on team be better than raw #?
Not sure what’s happening here, but this is incorrect. The Bears have 26 drafted players still on the team.
|Number | Player | Years|
|9 | Jaquan Brisker | 3|
|10 | Luther Burden | Rook|
|99 | Gervon Dexter | 2|
|6 | Kyler Gordon | 3|
|22 | Elijah Hicks | 3|
|47 | Ruben Hyppolite | Rook|
|23 | Roschon Johnson | 2|
|70 | Braxton Jones | 3|
|85 | Cole Kmet | 5|
|84 | Colston Loveland | Rook|
|25 | Kyle Monangai | Rook|
|65 | Luke Newman | Rook|
|15 | Rome Odunze | 1|
|90 | Dominique Robinson | 3|
|44 | Noah Sewell | 2|
|29 | Tyrique Stevenson | 2|
|19 | Tory Taylor | 1|
|75 | Ozzy Trapilo | Rook|
|95 | Shemar Turner | Rook|
|18 | Caleb Williams | 1|
|58 | Darnell Wright | 2|
|20 | Zah Frazier (NON) | Rook|
|72 | Kiran Amegadjie (IR) | 1|
|94 | Austin Booker (IR) | 1|
|1 | Jaylon Johnson (IR) | 5|
|32 | Terell Smith (IR) | 2|
*edit – alright I have no idea how to do tables on reddit anymore. I swear I once had the power. Those days are… gone
There is a trend here 🤔
What is the data normalization strategy here? Do we include # of picks? Do we include a variance based on round? Do we weigh anywhere? Is this just a raw number?
What I want to see is what percentage of bears draft picks went on to get a second contract. With the bears or elsewhere. Who’s still in the league. Not just with the bears.
Roughly 50% of all 1st round picks are even offered a second contract. Far less for subsequent rounds.
Above a 50% hit rate (second contract or better) is amazing. Below, about 40% is bad.
40%-50% is the average, if I remember correctly.
– “a 2023 analysis found that only about 44% of first-round picks from 2011-2020 signed a second contract with their original team, indicating a high turnover rate even for highly-touted players.”
Edit: The above quote is from Google and only applies to firsts. So, about 35% of all rounds would be considered average. Anything above that is good. Anything below that is bad.
two of the bottom 7 won 14 and 15 games each last year
not sure what we can exactly extrapolate from this
There’s a lot more questions, although fascinating to see an obvious correlation to wins/losses. Rookie contract QB’s would logically tend to skew the data to FA signings. Also, understanding who the current GM has under their watch on the active roster vs previous regimes. Then do a year over year comparison of those points to see if you are above or below the net trend.
Also, go Bears.
I mean as long as we are building through the draft. Curious what the date range of this data population is though. Also curious as to what the stats look like for the past 3 or 4 years.