
![[OC] Impact of every Week 7 game on Rams playoff odds.](https://www.rawchili.com/wp-content/uploads/2025/10/69RPj4F97Ic13381aj8lBqFjLA6p_JfE-LBgV9jPSaM-1600x1024.png)
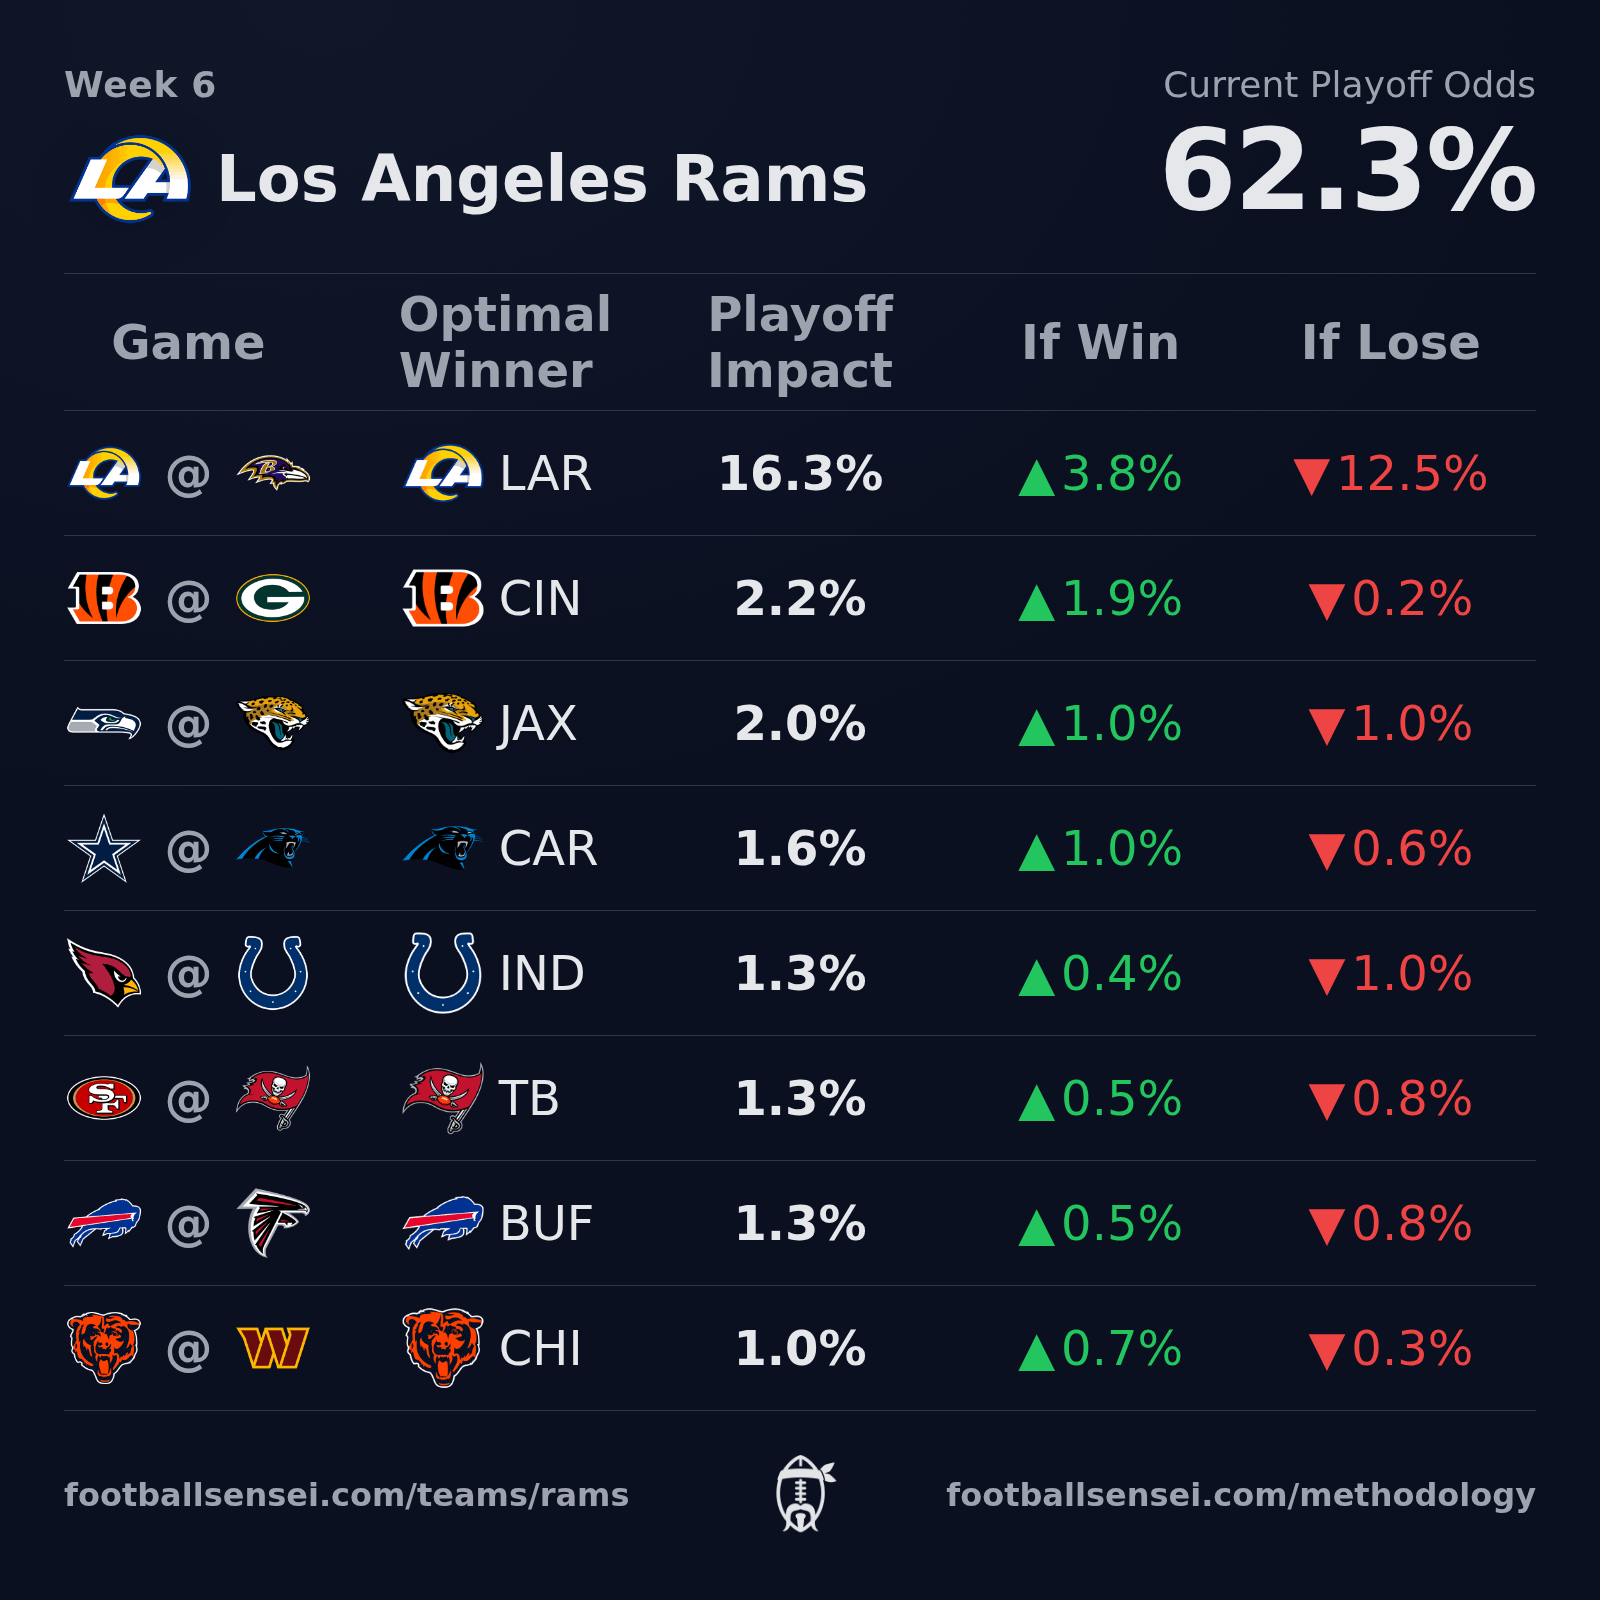
I ran 5 million Monte Carlo simulations of the season to figure out what the playoff implications of every week 7 game are.
The Rams current odds to make the playoffs are 78.9%.
- If you beat the Jaguars, that goes up to 85.0%, but if you lose, it drops down to 70.5%. It's a swing of 14.5%.
- HOU @ SEA is the second most impactful week 7 game for you guys. If the Texans win, your playoff odds go up by 1.0%. If the Seahawks win your playoff odds go down by 0.6%.
- WSH @ DAL is the third most impactful game with a total impact of 1.1%. Your playoff odds go up if the Cowboys win.
I also made a website and posted the full results there. I'll update it every week with the upcoming games. Here's the data:
| Game | Optimal Winner | Impact Δ | If Win | If Lose | Game Time |
|---|---|---|---|---|---|
| LAR @ JAX | LAR | 14.5% | +6.1% | -8.4% | Sun 10/19 9:30 AM ET |
| HOU @ SEA | HOU | 1.6% | +1.0% | -0.6% | Mon 10/20 10:00 PM ET |
| WSH @ DAL | DAL | 1.1% | +0.6% | -0.5% | Sun 10/19 4:25 PM ET |
| NYG @ DEN | DEN | 0.9% | +0.2% | -0.7% | Sun 10/19 4:05 PM ET |
| NO @ CHI | NO | 0.9% | +0.6% | -0.3% | Sun 10/19 1:00 PM ET |
| TB @ DET | TB | 0.8% | +0.5% | -0.2% | Mon 10/20 7:00 PM ET |
| GB @ ARI | ARI | 0.7% | +0.5% | -0.2% | Sun 10/19 4:25 PM ET |
| CAR @ NYJ | NYJ | 0.7% | +0.4% | -0.3% | Sun 10/19 1:00 PM ET |
| PHI @ MIN | PHI | 0.3% | +0.2% | -0.2% | Sun 10/19 1:00 PM ET |
| LV @ KC | KC | 0.2% | +0.0% | -0.1% | Sun 10/19 1:00 PM ET |
| NE @ TEN | TEN | 0.0% | +0.0% | -0.0% | Sun 10/19 1:00 PM ET |
| PIT @ CIN | CIN | 0.0% | +0.0% | -0.0% | Thu 10/16 8:15 PM ET |
| IND @ LAC | IND | 0.0% | +0.0% | -0.0% | Sun 10/19 4:05 PM ET |
| MIA @ CLE | MIA | 0.0% | +0.0% | -0.0% | Sun 10/19 1:00 PM ET |
| ATL @ SF | ATL | 0.0% | +0.0% | -0.0% | Sun 10/19 8:20 PM ET |
I use this data as a rooting guide for the 1-3 games each week where I don't already know who I want to win.
If you want to see the details of my methodology for the Monte Carlo simulations, look here.
You can also see which teams are rooting for and against you this week here.
There's also a What-If Tool where you can pick winners and losers of any games this season and recalculate your odds.
4 comments
I go into more detail on the [Methodology](https://footballsensei.com/methodology) page, but here is a summary of the model:
I use Elo scores to represent relative team strength. For each game in the season I calculate win/loss odds based on the Elo of the two teams plus an adjustment for home field advantage. I do a Monte Carlo simulation of the season 5 million times and analyze the results.
To get the start of season Elo ratings I combine 2 approaches. The first approach is taking the Elo score for each team from the end of last season and regressing it slightly towards the mean to account for offseason changes. The second approach is using Vegas total season win odds to infer an Elo.
Elo updates during the season based on wins and losses in the standard way. To account for mid-season injuries and trades, I do a final adjustment to Elo each week based on the Vegas game lines. If Vegas has different game odds than what results from my Elo calculations, I adjust Elo to better match the Vegas lines, with a bias towards Elo reduction since the biggest changes are usually from injuries.
What are the odds of Karty affecting the outcome?
let’s just win every single game from this point out. safer that way.
Thanks for the data! You are doing god’s work, we appreciate it!
It’s must be tough doing this for all 32 teams. But it’s really fascinating!