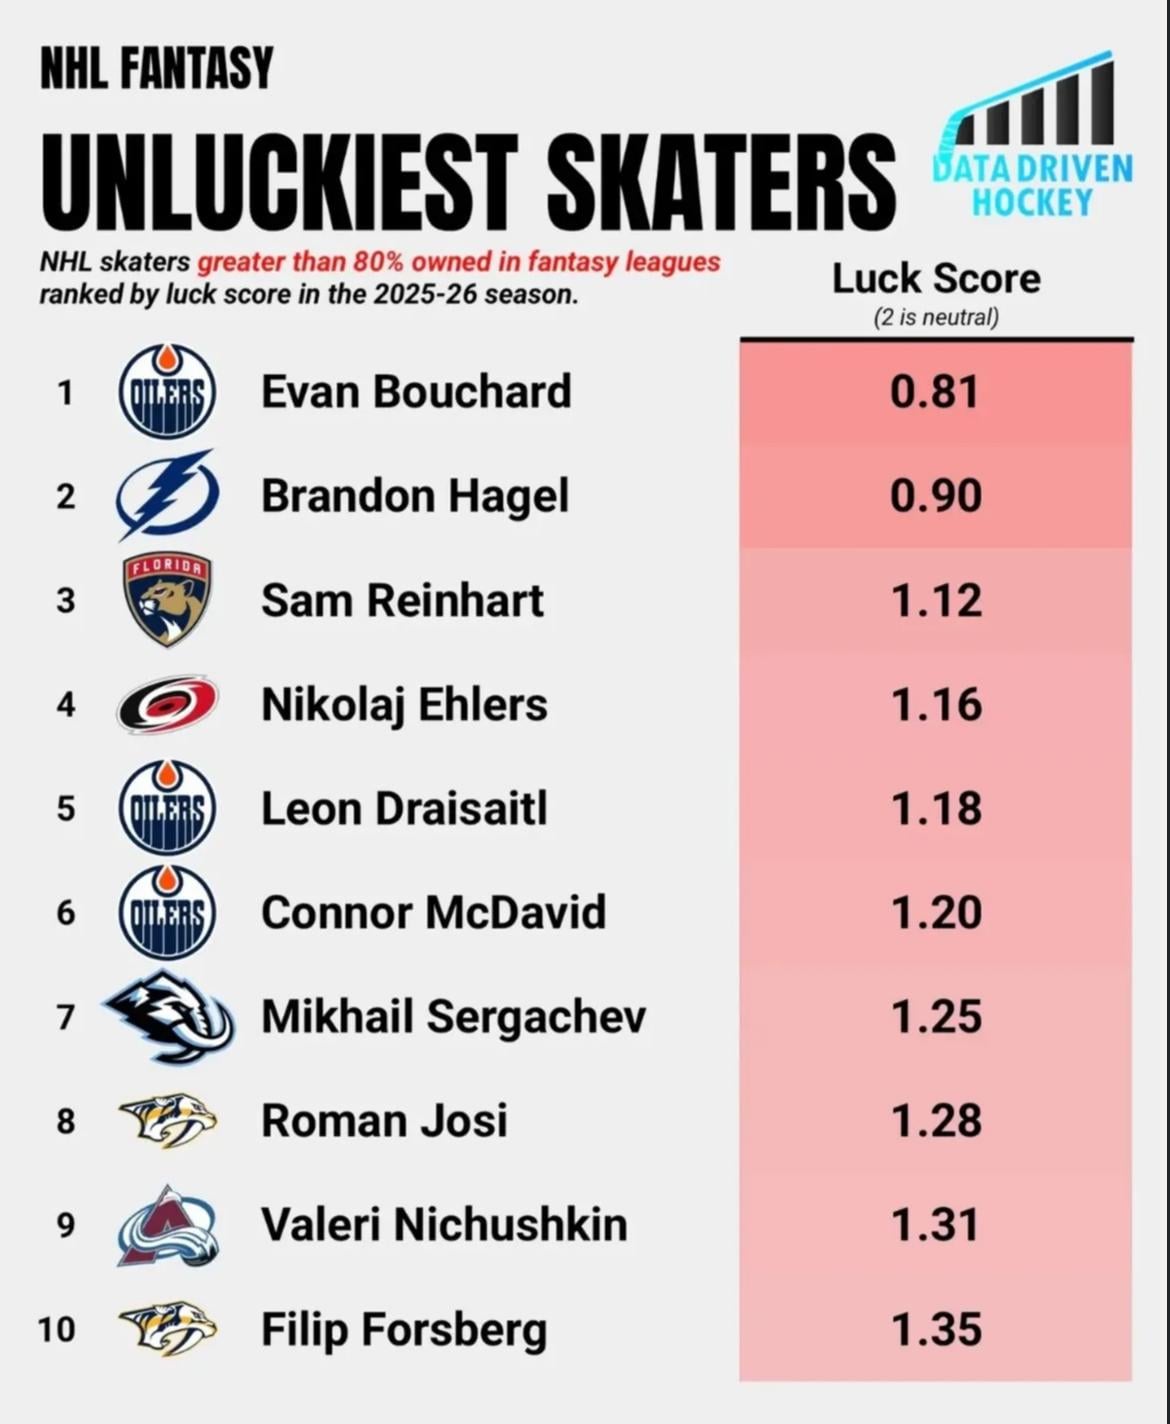
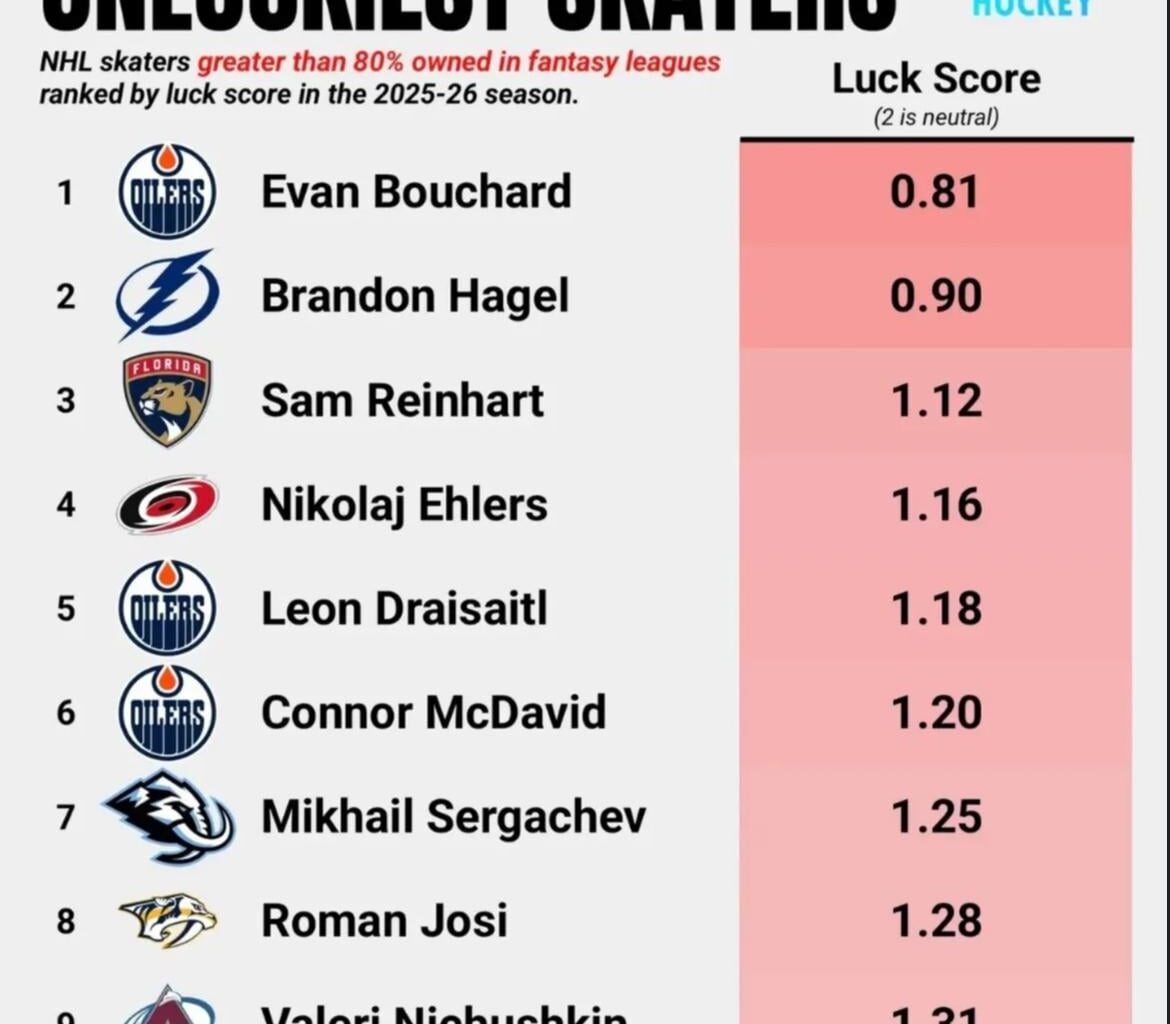
Ehlers is one of the unluckiest skaters in the league per Data Driven Hockey
October 21, 2025
Ehlers is one of the unluckiest skaters in the league per Data Driven Hockey
6 comments
Data Driven Hockeys Explanation: The philosophy behind luck score is simple – produce a single number that can evaluate whether a player’s production in a small sample is indicative of what we can expect their production to be over a larger sample. Long-time followers may remember my luck score equations/approaches from past seasons – this season’s approach builds off those and (I believe) improves them considerably. The major difference this year being the inclusion of a player specific ‘Results Baseline’.
A skater’s baseline results at even strength and on the powerplay are calculated from the results equation above using the players’ most recent 3 seasons of data (current season data is included in this baseline, and as the season progresses less data from 3 years ago is used). The current season results use the same equation, but only data from this year is used. Then, luck score is calculated by taking the ratio of current results to baseline results at both strength states and summing them. Thus, a player getting the same results they usually get will have a score around 2, while a player getting more luck will be over 2 and a player getting less luck will be below 2.
The Results equation terms:
GF/xGF – the ratio of a players on-ice actual goals to on-ice expected goals. Over larger sample sizes players who are more skilled (at passing, finishing, etc.) will have higher values of this.
Points/GF – individual points percentage (IPP). It measures the fraction of the goals a player is on the ice for that they get a point on. High end players max out at an IPP around 80% over large samples.
oiSH%/av-oiSH% – the ratio of on-ice shooting percentage to league average on ice shooting percentage. This is like the GF/GF ratio – highly skilled players will have higher values this ratio over large samples.
And I have 3 of these guys on my fantasy team lol
Ah it’s alright. Luck is just statistics and he’s been an outlier on the wrong side. It’ll even out to the mean soon.
He’s factored into goals but just hasn’t been able to pot one, I thought he would get it last night. He’s looked great so far either way. He’ll get rolling eventually and we’ll have so many goals scored we won’t know where they came from. We’ll have to say “check the Ehlers goal shelf.” And they’ll come back and say that’s exactly where they came from.
Trading Tom Wilson for Ehlers might go down as one of the best trades in my league.
It’ll happen soon. He’s been all over it. Couple of mishandles and maybe some shaken nerves, but the effort looks there unlike someone from last year…