
Based on questions from r/WSU:
- What is this chart showing?
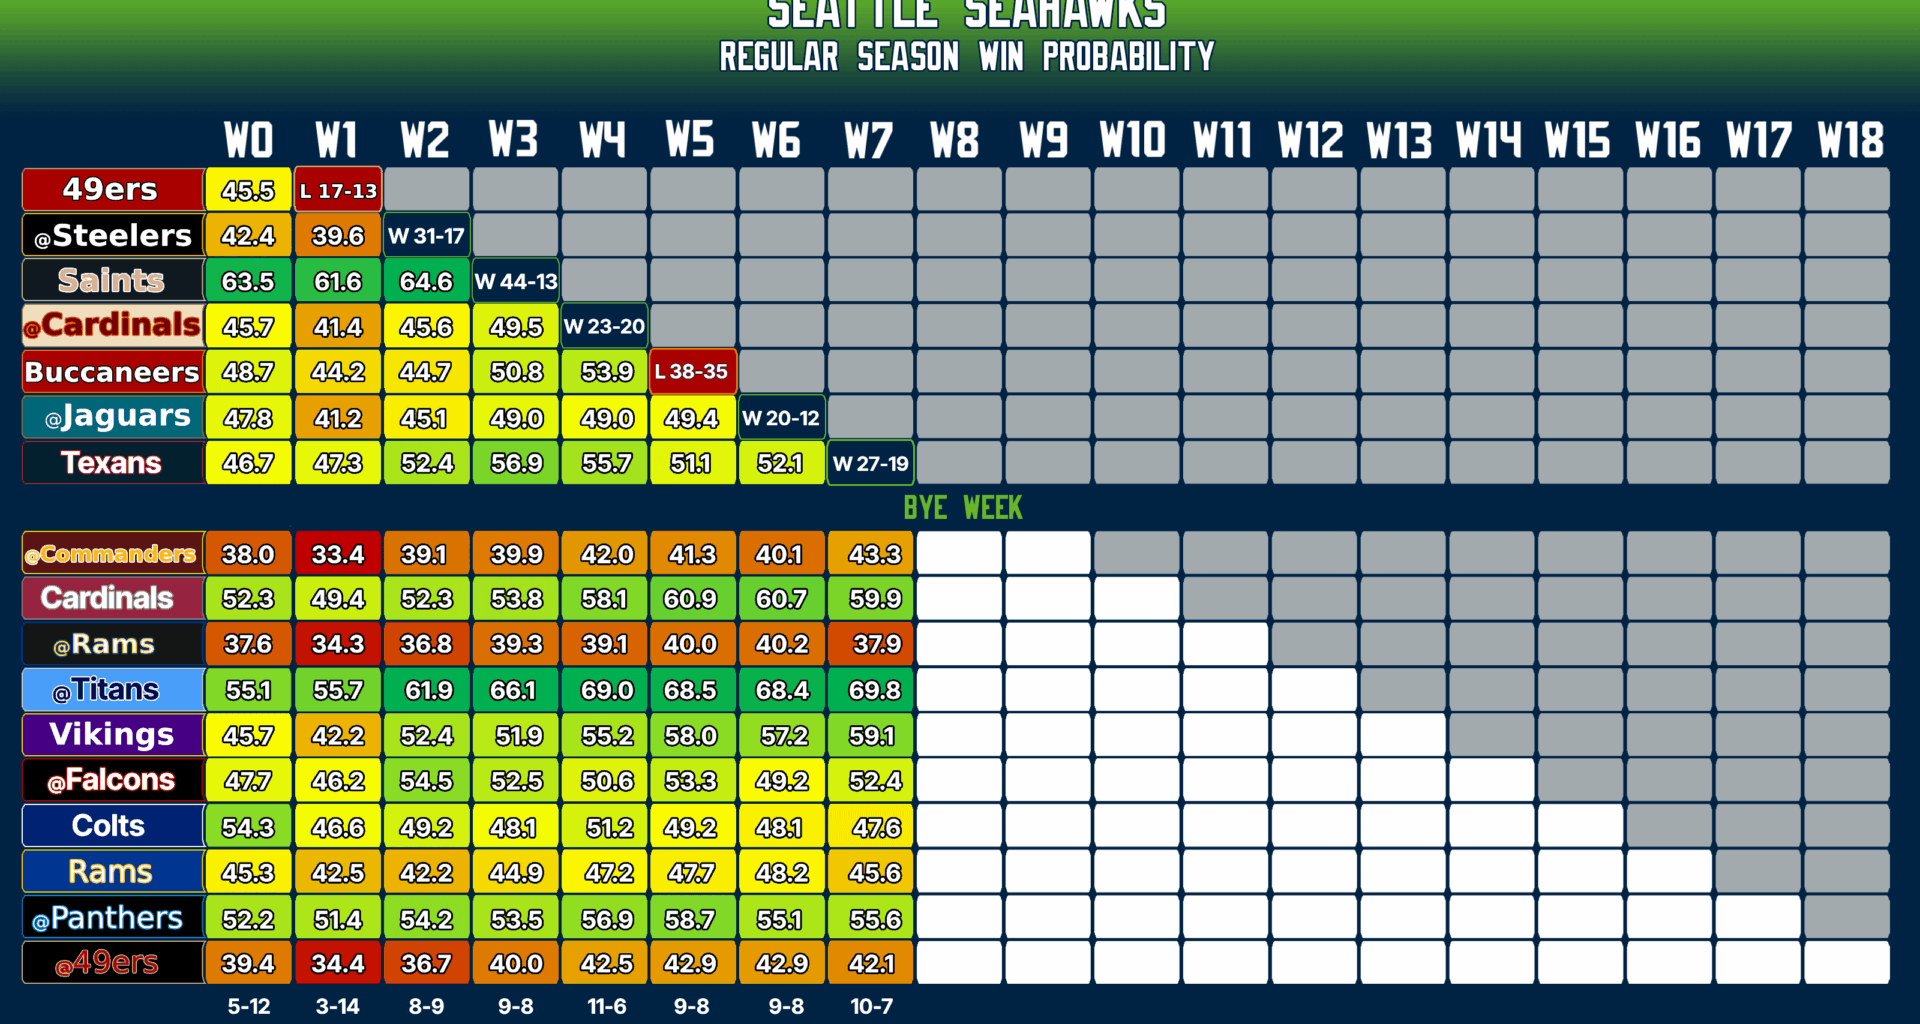
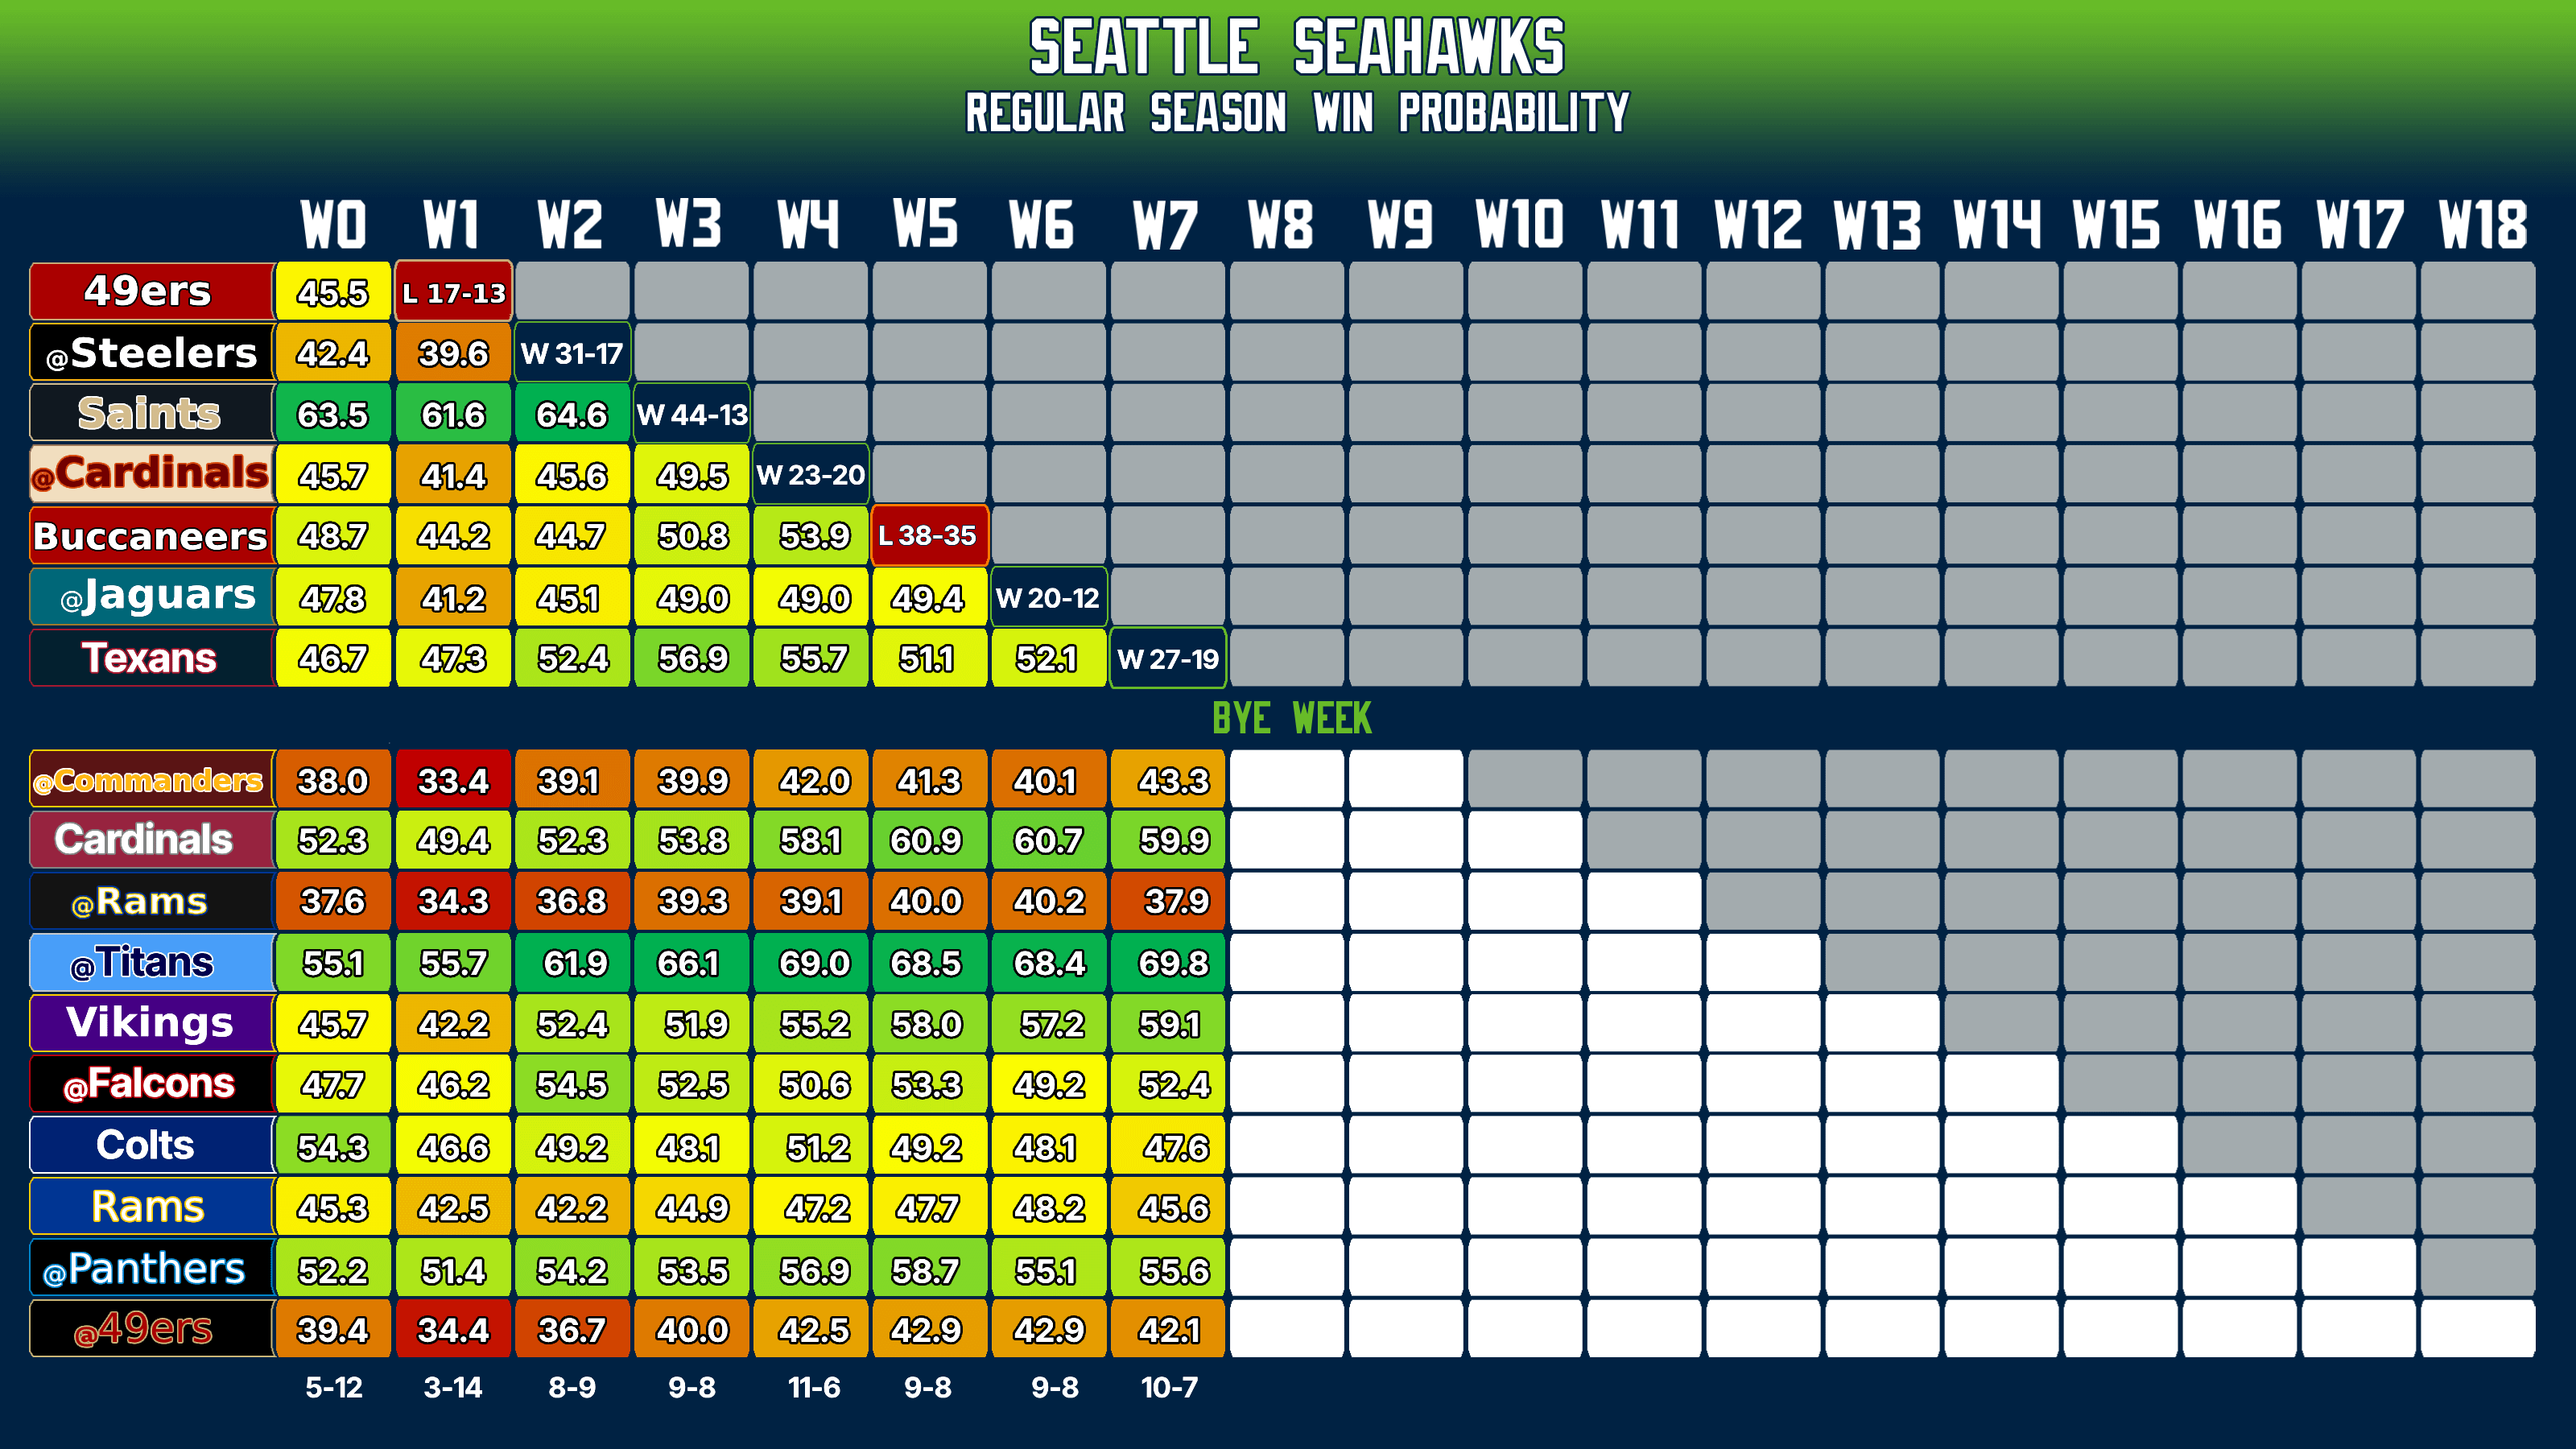
- This is a weekly heat map that tracks the Seahawks chances of winning each game during the season. The numbers represent the ESPN FPI’s win percentage.
- What is FPI?
- ESPN's Football Power Index (FPI) is a predictive model designed to measure a team's strength. It predicts the team's future performance based on several factors such as past performances, remaining schedules, and in-game stats. These win percentages reflect how likely each team is to win its upcoming game.
- Why do the numbers change week-to-week?
- The FPI updates weekly based on the latest results, injuries, and team performances. A team’s performance (and the performance of their opponents) in the previous week will cause the FPI to adjust the percentages.
- How do you calculate these numbers?
- The numbers come directly from ESPN’s FPI Matchup Predictor. I just plot the win percentage as a heat map to visually show how Seattle's chances improve or decline throughout the season.
- What do the colors mean?
- The colors represent the likelihood of Seattle winning that game, ranging from red (lower chances of winning) to green (higher chances of winning). It gives a visual sense of how favorable or tough each matchup is for the Hawks.
- Is this predicting game totals or win percentage?
- This chart represents win percentage, not the score or spread of the game. The numbers show how likely the Hawks to win each game based on current data from ESPN's FPI.
- HEY! When I looked at the win chance it said 70.2 NOT 70.1! You're a phony, a big fat phony
- I update the heatmap on Sunday nights using the latest ESPN FPI data. However, the FPI might slightly adjust percentages throughout the week due to new data inputs, changes like 70.1% to 70.2% are common. Please keep this in mind and don't hold it against me; these are based on continuously updated models.
- Why doesn’t it add up to 100% for each game?
- These percentages reflect Seattle's chances of winning, not a balance between two teams’ chances. They’re independent from each other, so each game only shows Seattle's win probability, not a direct competition between the teams in this context.
- Why did [opponent] drop/increase in FPI after winning/losing?
- The FPI system updates based on more than just the final result; it also factors in how a team performed compared to expectations. A team might win but underperform relative to projections, causing their FPI to drop. Conversely, a team could lose but exceed expectations, and their FPI could improve.
- We play the X team twice, why are there different percentages?
- A number of factors could cause the percentage to change. Home vs Away, weather, time of day, travel, recovery time between games. Luckily I don't do the calculations, I'm just interested in the data.
- Why do you update this each week?
- It’s interesting to track how the Hawks win chances change over the season as teams perform differently each week. It helps to visualize the impact of Seahawks games and their opponents' games… and I'm a nerd.
15 comments
You totally can lose a bye week! Someone gets injured doing something stupid on vacation. And… didn’t we have players get arrested during a bye week in the early 2010s?
We could win if the Texans could pull off a miracle and beat the 49ers. Fat chance of that though.
I like these.
We’re on the road against the Commanders and they’re down JD5. 50-13 Hawks.
I will say I think the rest of the results are pretty close though. Can definitely see 11-6.
FBI snatching up some coach or player in a gambling sting would qualify as a Bye week loss.
43% chance of beating a reeling Commanders team without their star QB? Okay ESPN
Finally, a break from the roller coaster. It ain’t easy being a Seahawks fan.
Looking at the future, that Rams game is a massive test for this year’s squad. Surprised the chart gives up decent odds against the red hot Colts.
Our future will be decided by our divisional games. As it should. WITNESS!
this is so wonderful
Our friend Lockett couldn’t stomach the hawks coming to town vs Titans. With our road dominance, I see at least a 12 win season.
I’ve seen this chart every week and I still don’t know how to read it
Honestly we should be favored over the commanders. There’s no guarantee their starting quarterback even plays, although mariota did play pretty good against the raiders.
But the rest of the schedule looks pretty manageable.
Rams on the road is probably an L.
Cards at home is probably a W, but could be a trap game.
At titans and minnesota at home should be manageable wins to get us to 9. Then the tough stretch.
At falcons, then colts at home could be back to back losses. Both teams are playing pretty good, atlanta having an excellent defense, and indianapolis having an excellent offense.
Rams at home is no guarantee.
Then finishing with panthers and 49ers on the road.
If we win those last two and drop the middle 3 like i predict, we’re probably looking down an 11-6 record, maybe 12 or 13 wins if some craziness happens and we flip one of the rams games or the atlanta matchup. But of course losing to the cardinals or niners puts you right back at 12 or 11.
Thanks for sharing these it’s interesting. 10-7 I don’t think gets into wild card this year
This chart says we have a 43.3% chance to beat the commanders
MAWWTWFT?
U/Palonius is so real for making these. This was the only thing keeping me going through last year’s Wazzu season lmao. Glad to see the Hawks version