
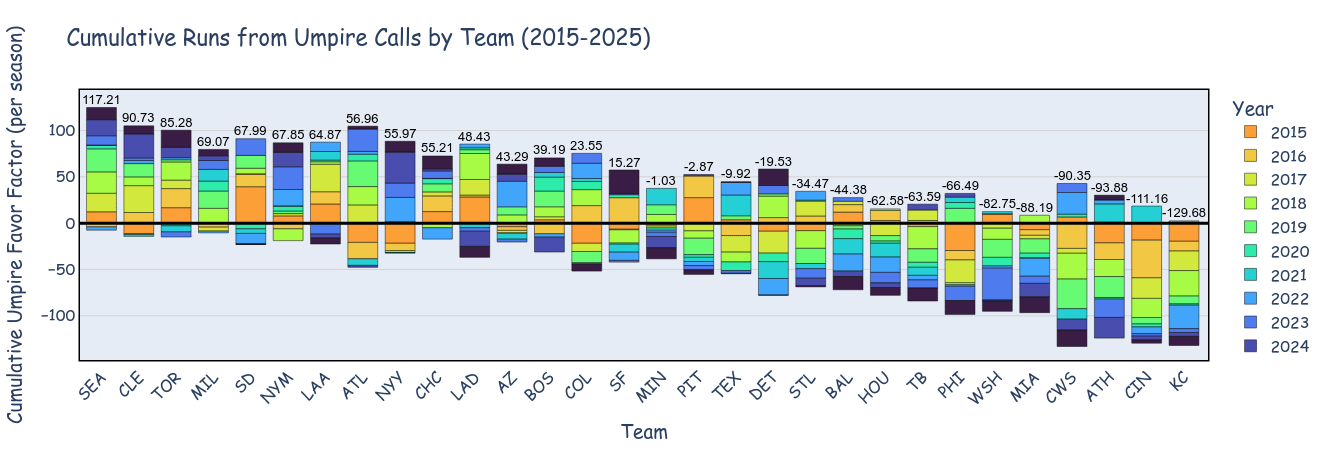
* Based on umpscorecards "Run Favor" data. Numbers above the bars are cumulative, so the top minus the bottom
After having used the UmpScorecard API, I have created a chart showing the Cumulative Favor each team has accumulated by year since Statcast tracking has become available.
33 comments
They need it
The Mariners are ruining baseball /s
[removed]
The interesting thing to me is that seemingly there’s a correlation between the “worst” teams and umpire run impact.
Sarcasm – are umpires intentionally suppressing the worst teams to keep certain teams at the top?
I feel this type of analysis highlights how good a team’s catcher is at framing more than anything.
Of course they should be. They’re the protagonists of baseball
Can we draw correlation line with pitch framing stats for each team? I’d be curious the level of effect
It helps that the M’s rotation mantra is just throw strikes and Cal Raleigh is an amazing pitch framer. It’s probably enough for the ump to give the borderline call if they’re unsure.
What an odd way to show the chart.

I feel like this is a chart that shows Sal Perez getting a little older every year
Why does the darkest blue shade in the chart not appear in the legend?
This means they’ve been to the playoffs more than twice in the past 11 years and maybe even won a world series, right?
Mariners aren’t doing much with that extra .065 runs per game.
Unfortunately it looks like most of those runs we got were during some bad years.
The effect of excellent framing from catchers like Higgy, Trevino, and Wells is very evident if you look at the shift in recent years with the Yankees.
Thank god for Tanner Swanson
This confirms my preconceived notions so I support it. If this included replay I think it’d be even more lopsided
nice to see that our 2016 and 2017 seasons weren’t heavily impacted by umpire choices.
Though, one of the ALDS games in 2016 had the most ridiculous strike zone.
Looks like everyone feels sorry for us…
God damn Cubs and Brewers getting the reacharound from the league, am I right Pirates and Reds fans?
I fucking knew it
(This one chart will allow me to complain about the umps for the rest of my life)
Witchcraft too
Salvador Perez moment
This is just an Austin Hedges stat
I refuse to accept framing is a real thing because I love Salvy too much. I know I’m wrong, but stats like this hurt to see 🙁
I’m still haunted by what Dave Rackley did to Triston Casas in the opening series in Seattle in 2024. Crimes were committed.
That is both an awful metric to make that determination and absolutely not what the data is saying.
Baseball is truly a numbers nerd’s dream
Worst case is KC at 130 runs over 11 seasons. That’s ~12 runs per season. A win is about 10 runs, so they have lost about 1.2 win per season, which doesn’t seem so horrible unless you’re a team that’s always fighting for a wild card spot.
The numbers also align with Salvador Perez being known as a poor framer. And that 1.2 wins per season matches almost exactly the diff between his bWAR and fWAR, which is about 1.2 WAR per season. So close that I’m guessing Fangraphs is probably using the same raw data source as this chart for its framing calculations.
Houston is being held up by the first half of data. Since the sign stealing scandal came out (Dec 2019), Astros have ranked near the bottom. No, I’m not denying the Astros cheating. Yes, I do believe others were also cheating. But that’s not my discussion here. I just think it’s interesting that when the Astros switched from being the underdog darling of the MLB to the most hated (or at least one of the most hated) teams in MLB, the umps have also followed suit with that sentiment. You can say what you want. Scream, “they deserve it”. I personally think umps should be impartial. We all know that’s not the case.
It’s because we are nice and they feel bad that we never make the playoffs, or compete, or please our fan base… until now 🙂
This is just a “spot the Austin Hedges years” graph in disguise
Even the ump show roots for them truly Americas team
i always know where to look to find my giants