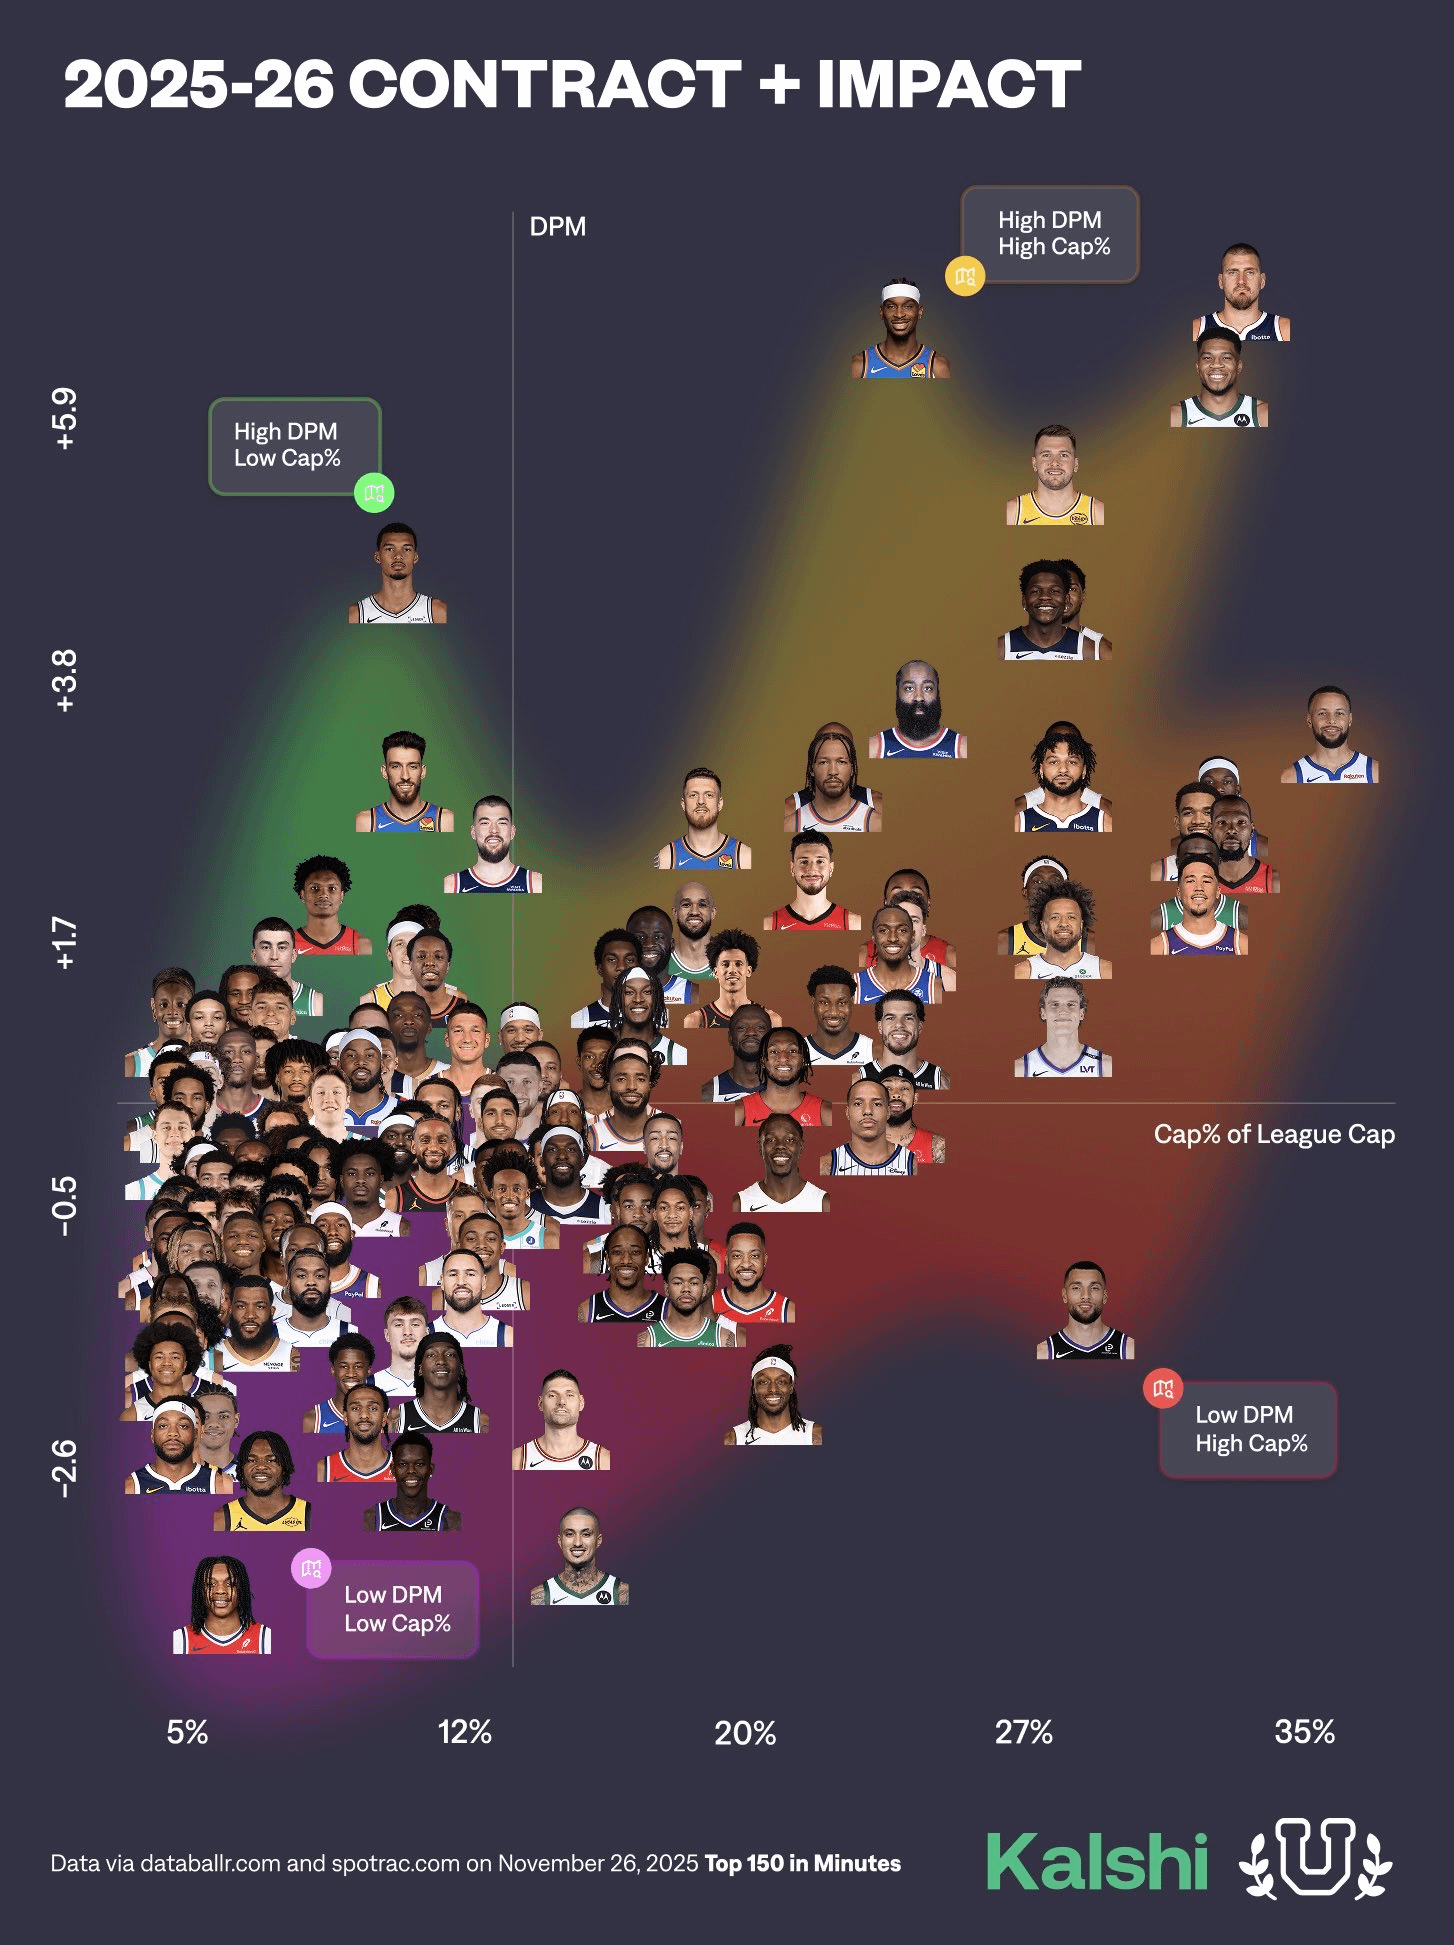
Bad graph, colors don’t do anything and makes it confusing what the axes are
To be clear, being on the right isn’t necessarily a good thing. It’s the distance to some line y = a + bx that matters, where a and b are determined by linear regression ( I think?)
So even without knowing the exact line, we can see that wemby has the most bang for the buck contract, as well as Shai and chet.
Of course, this will change as they get paid more after rookie deals / supermax deals.
This also shows Jamal is likely slightly overpaid
Kuzma is my only takeaway from this graph
Can somebody pinpoint Lebron? Cant find him
As i understand, How to read this graph. Draw a 45 degree diagonal line. Everything above is underpriced. Everything below is overpriced (lavine, mpj etc). Jamal is slightly overpriced. Jokic is on the money.
Anyone celebrating this, sga Chet and wemby are the best spots on this graph
The colour coding is all off.
You should have it the greener the father you go up from the 45° line. To purple as you go down.
The worst player in this chart is Zach Lavine.

9 comments
r/toprightjokic
Bad graph, colors don’t do anything and makes it confusing what the axes are
To be clear, being on the right isn’t necessarily a good thing. It’s the distance to some line y = a + bx that matters, where a and b are determined by linear regression ( I think?)
So even without knowing the exact line, we can see that wemby has the most bang for the buck contract, as well as Shai and chet.
Of course, this will change as they get paid more after rookie deals / supermax deals.
This also shows Jamal is likely slightly overpaid
Kuzma is my only takeaway from this graph
Can somebody pinpoint Lebron? Cant find him
As i understand, How to read this graph. Draw a 45 degree diagonal line. Everything above is underpriced. Everything below is overpriced (lavine, mpj etc). Jamal is slightly overpriced. Jokic is on the money.
Anyone celebrating this, sga Chet and wemby are the best spots on this graph
The colour coding is all off.
You should have it the greener the father you go up from the 45° line. To purple as you go down.
The worst player in this chart is Zach Lavine.
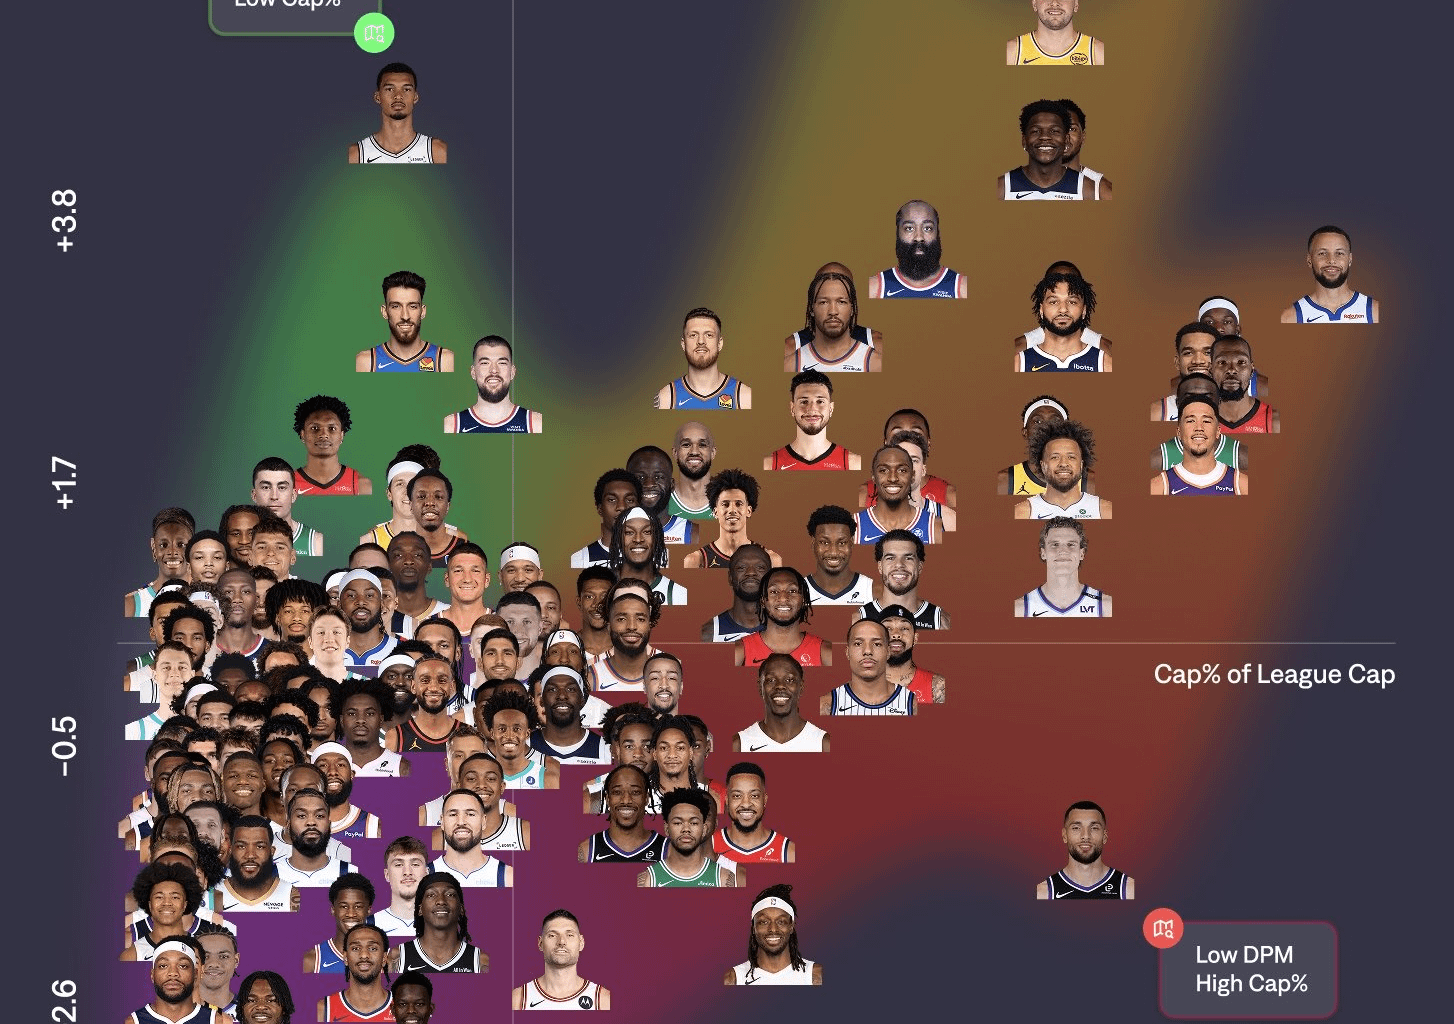
https://preview.redd.it/m6l0q6g2cr3g1.png?width=946&format=png&auto=webp&s=e82712df8e20b4003440db0e5d9eb4173a2d6c70
very interesting ,
i was expecting stephon castle,cedric coward,norman powell , timhardaway jr,cason wallace,austin reaves to be
On the top with a very low salary compared to their impact but this chart might still be not totally right