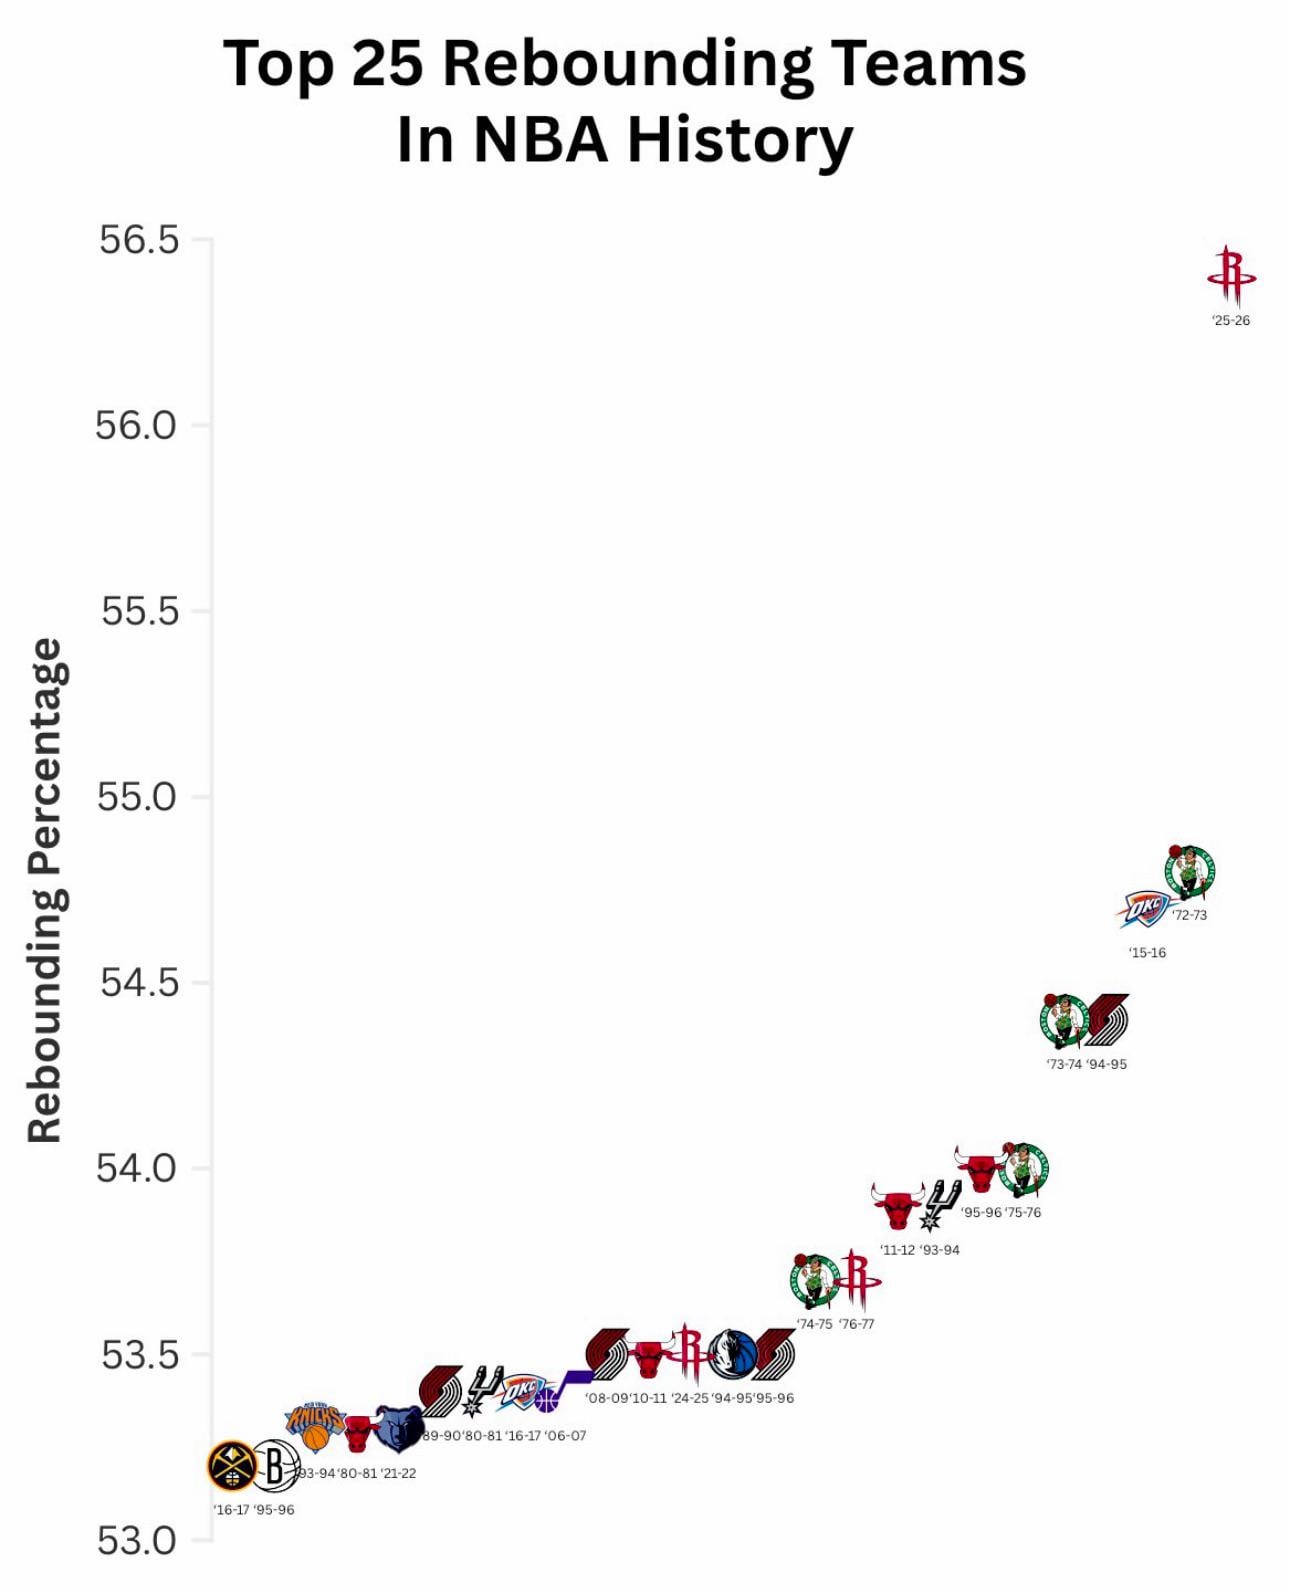
5 of the top 25 are Steven Adams teams with 3 different franchises (HOU ‘25-26 & ‘24-25, MEM ‘21-22, OKC ‘15-16 & ‘16-17)

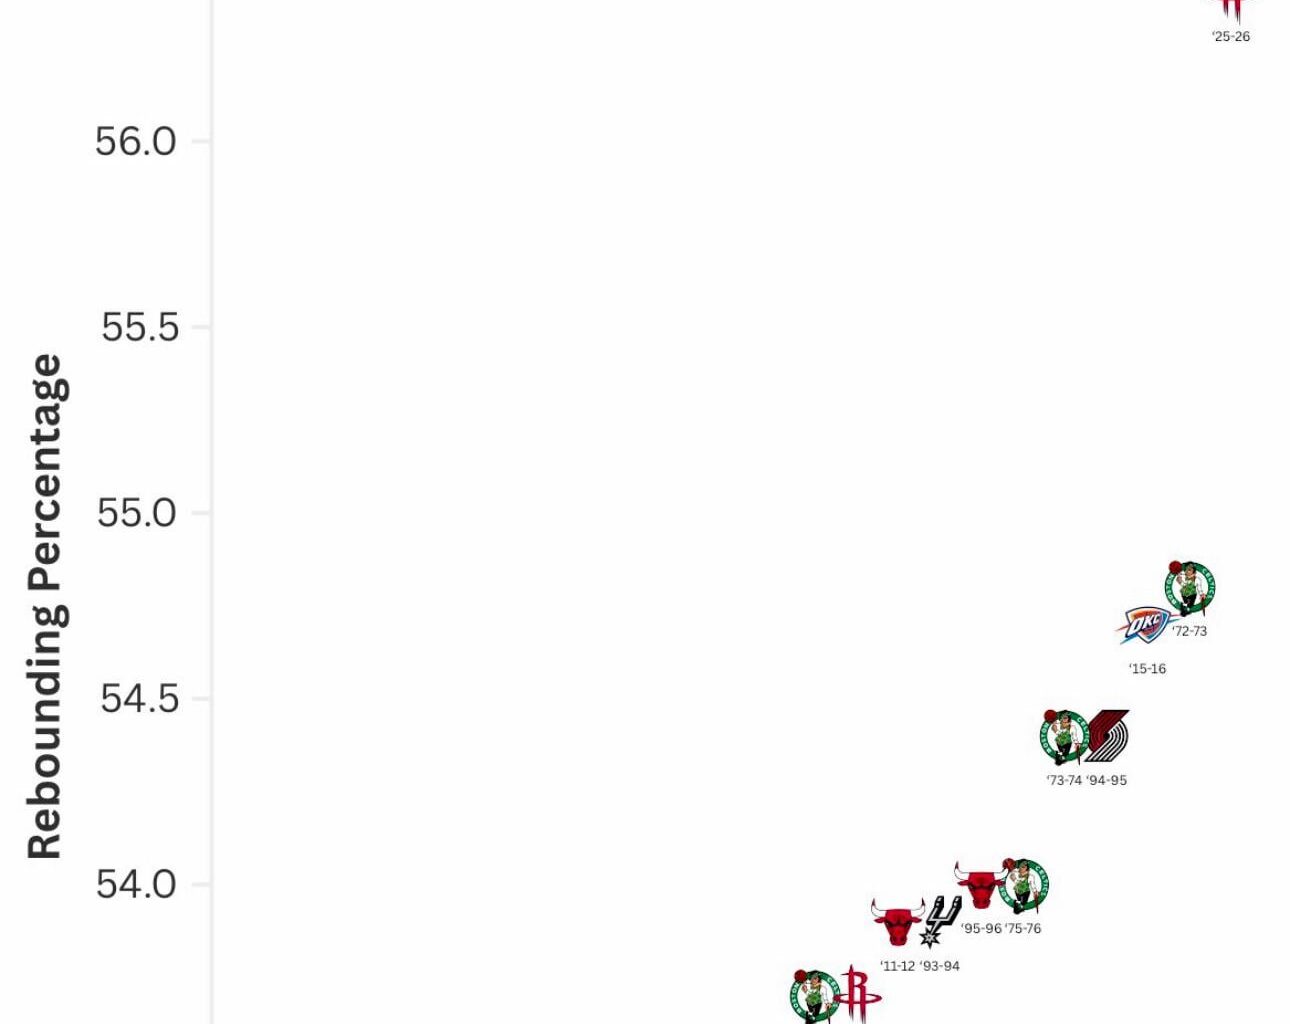
5 of the top 25 are Steven Adams teams with 3 different franchises (HOU ‘25-26 & ‘24-25, MEM ‘21-22, OKC ‘15-16 & ‘16-17)
11 comments
the leap from last year is the most surprising.
this chart is a crime against mathematics
Is Steve-o the GOAT rebounder?
Beating the record by a whopping 1.5% boys we’re really blowing them out of the water
[deleted]
Houston’s 2023 team should appear on this chart, too… they were north of 53%, iirc.
Unfortunately it doesn’t seem to translate into championships. I suspect it’s because it means your offense is missing a ton of shots too
What’s the other axis?
This is one of the worst graphs I have ever seen in my life.
Doesn’t mean much in this era
Can we realistically bully the OKC Thunder on the glass enough to offset the number of TOVs they’ll force on us?