
Fans love to blame the “loser point” for inflating the standings, so I wanted to compare two teams that are actually very similar underneath the surface: Anaheim and Chicago. Both are rebuilding, both play a lot of close games, and both have uneven 5-on-5 results. Yet the point system ends up making Anaheim look like a much stronger team than Chicago, even though most of the gap has nothing to do with true on-ice separation.
Right now, Anaheim sits at 19-10-1 (.650) and Chicago is 13-11-6 (.533). A difference of .117 in point percentage gives the impression that Anaheim is a solid playoff team while Chicago is stuck fighting on the bubble. The natural question is whether the teams are actually that far apart or whether the point structure is creating the illusion.
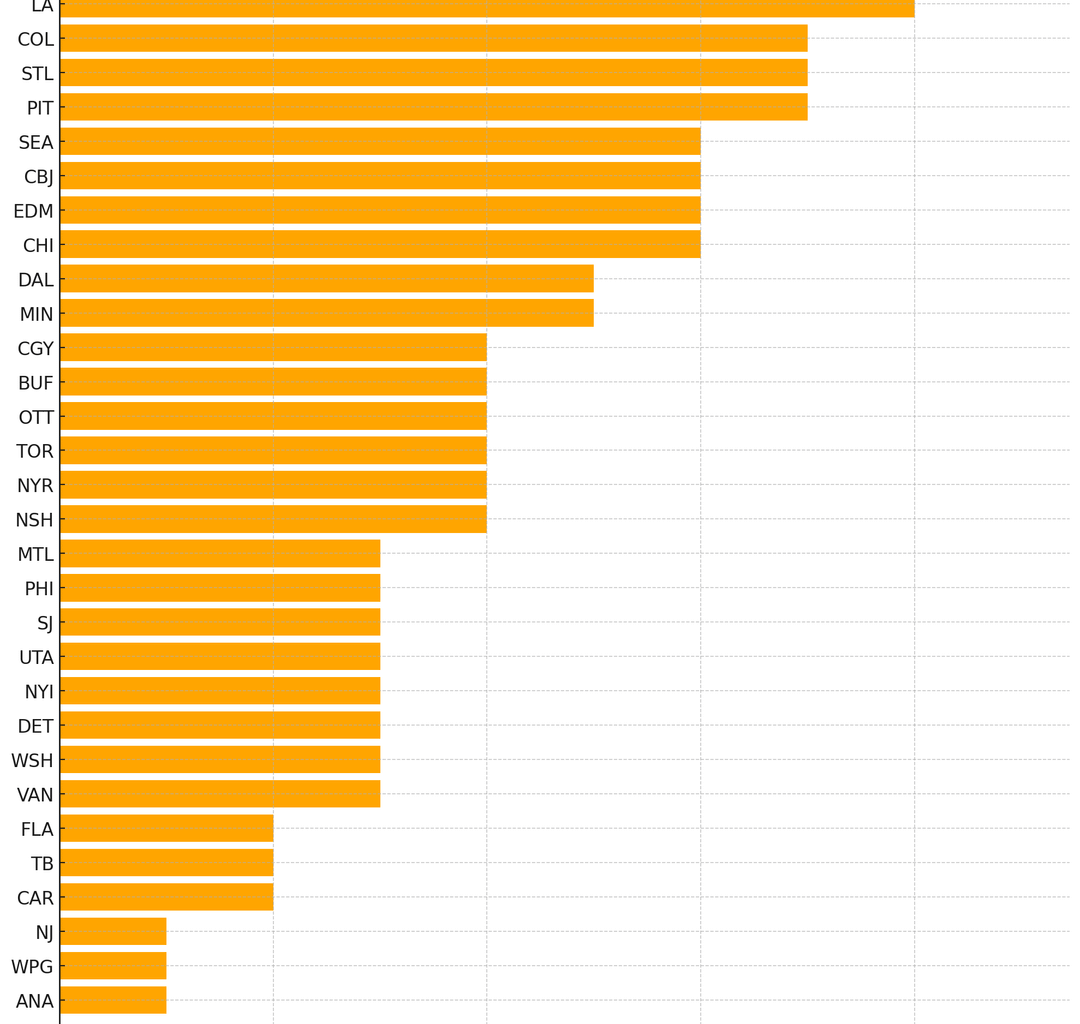
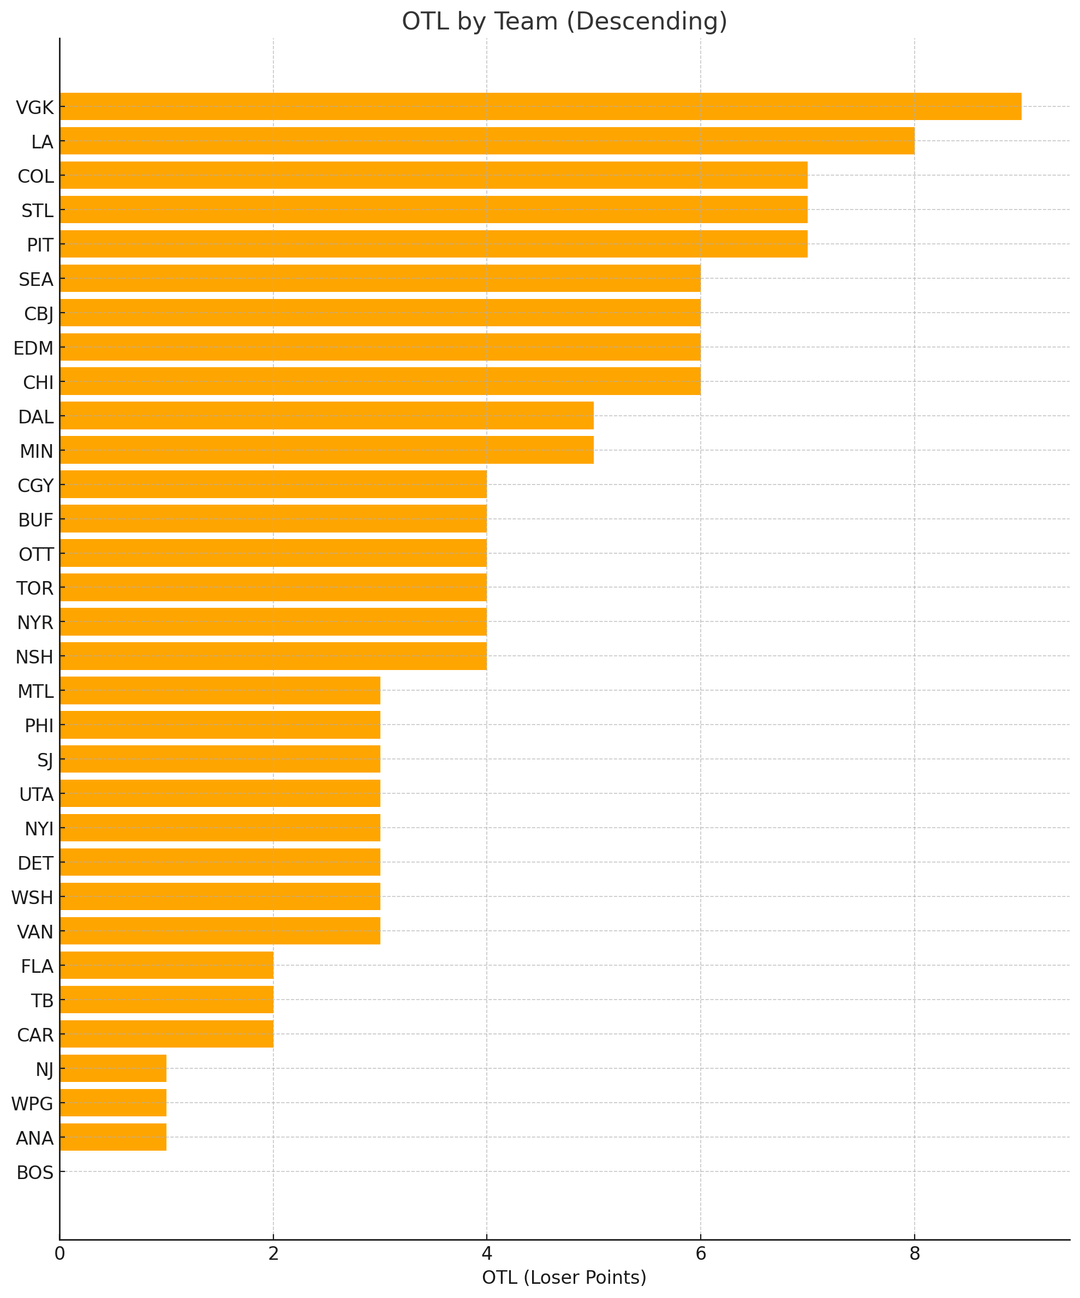
The first thing many fans look at is the “loser point.” Anaheim has only one OTL, while Chicago has six. If this part of the scoring system really distorted the standings, removing it should bring the two teams closer together. Instead, the opposite happens. Treat every overtime loss as a regular loss, like in the tie era, and Anaheim becomes 19-11 (.633) while Chicago drops to 13-17 (.433). Anaheim still grades out as a playoff team. Chicago falls toward the lottery. The gap gets larger, not smaller. That outcome tells us that the loser point is not the driver behind the inflation people talk about.
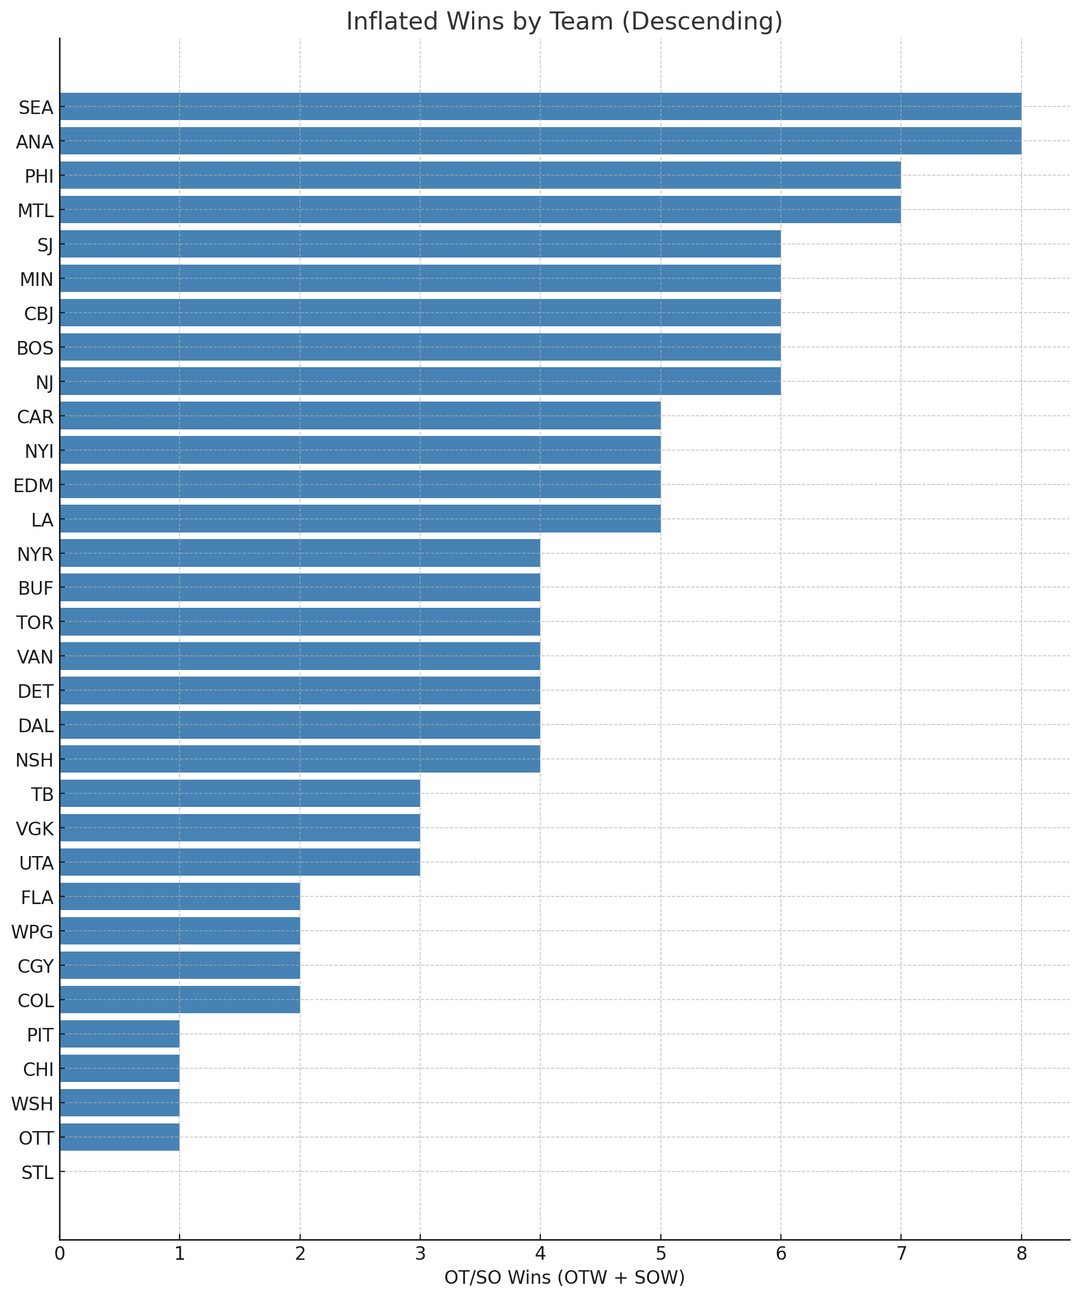
The real separation comes from overtime and shootout wins. These results occur after the sixty-minute hockey game is finished, but they count exactly the same as a regulation win. Anaheim has eight of these victories: four in overtime and four in shootouts. Chicago has only one. If we convert those results into ties, the way the standings functioned for decades, the picture changes completely.
Anaheim becomes 11-10-9 (.517)
Chicago becomes 12-11-7 (.517)
They end up with the same point percentage.
This is much more in line with how the two teams actually play. Both look like bubble teams once the extra wins awarded after regulation are removed. Chicago is not being lifted by six OTL. Anaheim is the team getting the benefit, because it has been far more successful in the post-regulation environment.
That is the key insight. OTL totals do not predict which teams are being inflated. Teams climb the standings because wins earned in overtime or the shootout are treated as full victories. These results tend to buoy clubs that rely on individual skill or three-on-three play rather than consistent performance through sixty minutes. Anaheim fits that description perfectly. Chicago does not.
If you want to understand why the league appears to be full of “mid teams,” this comparison is a good starting point. Under a tie-based scoring system, Anaheim and Chicago are identical. Under the current system, Anaheim appears far ahead even though most of that separation comes from the way the NHL accounts for wins, not from the quality of the hockey being played
12 comments
What if the league used the 3-2-1-0 point system I’ve seen people talk about?
This is really interesting, thanks! (And well explained)
This could also be a large contributing factor in the big swings teams take from year to year. If an extra 10+ points can be earned in OT, and if OT has a degree of randomness, it’s conceivable that teams can swing 10 or more points without actually being better, or worse.
You seriously out here saying the standings are inflated by… wins?
Do you fart in bath tubs and laugh your ass off?
You’re an artist.
Can’t be inflated if you never win in OT! 😉
This is interesting. Shoot outs are one thing, but I don’t understand this recent hype to penalize teams that still win in OT. Pushing through fatigue to outplay the other team should be rewarded equally. The extra energy effort is still not ideal with such a packed game schedule.
Why would you remove the OT wins from Anaheim though. You used to get those even when ties were possible. Only SO should be for the comparison’s sake.
The proper comparison to the previous format would be to make an OT result worth 2 or 0 and anything that went into SO a tie. So Anaheim would be 15-11-4 (.566) and Chicago 13-15-2 (.466). They both got around 15% more points in the current format than they would have had so it’s hard to say it really favors one or the other.
I like the idea of breaking down teams’ records by goal margin. If you count all games that ended with a margin of one goal (including regulation, overtime, and the shootout) as equal you can see something interesting:
Anaheim
2+-goal wins: 9
1-goal wins: 10
1-goal losses: 7
2+-goal losses: 4
Chicago
2+-goal wins: 9
1-goal wins: **4**
1-goal losses: **13**
2+-goal losses: 5
Basically, this record format disperses the luck of overtime into the 1-goal record and introduces the lucky of empty net goals into the 2-goal record.
Guys stop winning you’re getting too many points!
What if inflated standing was precisely the point (no pun intended) of the system? It keeps teams competitive for playoff positions into March, which helps viewership in bubble markets.
Everyone is playing in the same system so who cares how you make the playoffs.
The other angle is that close games and parity is great for betting for sure.
The two teams in your example have played each other twice in the last few weeks. How do those results compare to your dataset?
If I remember right, the first game was close with a Blackhawks win and the second game was a blowout. The blackhawks didn’t even show up. Each team has had electric streaks and low droughts. Sports are fun.