Looking forward to the 2027 season when we have a new HC and can move on from our first round project QB with the knees of a 60 year old.
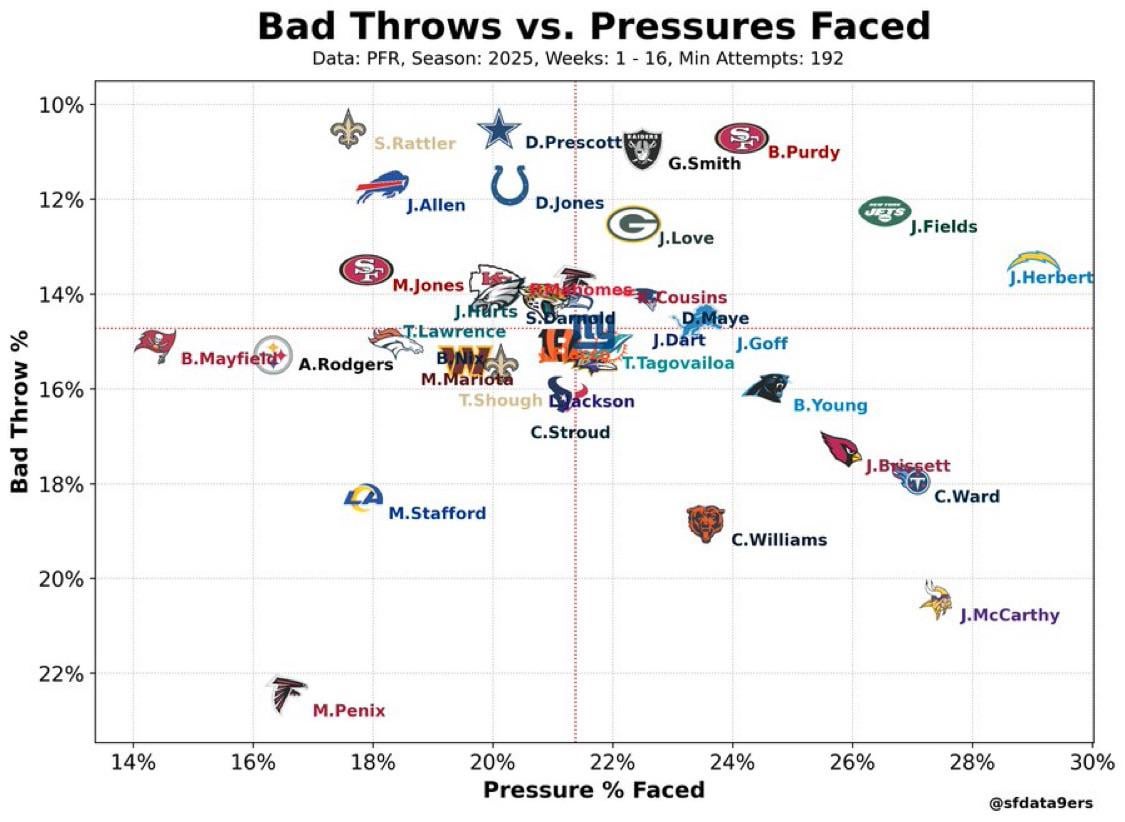
Everyone sees a graph and think that means something, if you only looked at this graph you would think Justin Fields if an MVP contender and Matthew Stafford is awful
We are closest to Matt Stafford!!
Why is the y axis inversed?
Just re read this. The y axis is inverted. We knew this all along. He just doesn’t have the accuracy. He’s doing worse than Nine in this case.
And as expected, Herbert is balling.
Next can we get a graph of 4th options missed vs. average distance of first downs? What is a bad throw, and why don’t the check down specialists throw them?
This passes the eye test. Penix seemingly panics when he gets pressure. I remember that one play where he threw it right even though his outlet was on the other side of the field.
Idk what to do withbthis because it leaves out a lot of context. Sure no pressure but are these tight window throws. Are the receivers getting separation? Penix has some accuracy issues as well so if you pair thay with any other thing that typically lowers a qb completion percentage then these charts will look really bad
Matthew Stratford is about to be MVP of the league and this graph you would think he’s one of the worst QBs in the league lol.
I’d still like to see what we have in Penix as a QB. He certainly needs to improve his accuracy. But I like that he doesn’t turn the ball over that often. That was a big problem with Ridder. Penix was able to get his completion percentage above 60 percent. As long as I see steady improvement and he can stay healthy.

10 comments
Looking forward to the 2027 season when we have a new HC and can move on from our first round project QB with the knees of a 60 year old.
Everyone sees a graph and think that means something, if you only looked at this graph you would think Justin Fields if an MVP contender and Matthew Stafford is awful
We are closest to Matt Stafford!!
Why is the y axis inversed?
Just re read this. The y axis is inverted. We knew this all along. He just doesn’t have the accuracy. He’s doing worse than Nine in this case.
And as expected, Herbert is balling.
Next can we get a graph of 4th options missed vs. average distance of first downs? What is a bad throw, and why don’t the check down specialists throw them?
This passes the eye test. Penix seemingly panics when he gets pressure. I remember that one play where he threw it right even though his outlet was on the other side of the field.
Idk what to do withbthis because it leaves out a lot of context. Sure no pressure but are these tight window throws. Are the receivers getting separation? Penix has some accuracy issues as well so if you pair thay with any other thing that typically lowers a qb completion percentage then these charts will look really bad
Matthew Stratford is about to be MVP of the league and this graph you would think he’s one of the worst QBs in the league lol.
I’d still like to see what we have in Penix as a QB. He certainly needs to improve his accuracy. But I like that he doesn’t turn the ball over that often. That was a big problem with Ridder. Penix was able to get his completion percentage above 60 percent. As long as I see steady improvement and he can stay healthy.