
The morning after the baseball world started to learn that Alex Bregman had signed with the Cubs, an interesting back-and-forth occurred in the company Discord (which you can access with a PL membership!) between Nick Pollack and Kyle Bland. Both the CEO and the Director of Analytics at Pitcher List were discussing Bregman’s loss of bat speed as the 2025 season went on, a trend that coincidentally aligned with a period of lower-than-usual aggression in the second half in the wake of a quad strain that kept him out from late May to mid July.
Those familiar with Bregman know that he loves to turn on the ball. His pull-air rate placed in the 87th percentile in 2025, and he doesn’t hit ground balls very often, which made him a tailor-made fit for Fenway Park and its Green Monster as a right-handed bat. Despite not quite being the same after the leg injury, he opted out of his short-term deal with the Red Sox and was rewarded with a hefty payday from Chicago. The thing is, though, bat speed wasn’t the only thing he gradually lost in the second half. He let the ball travel more and pulled less:
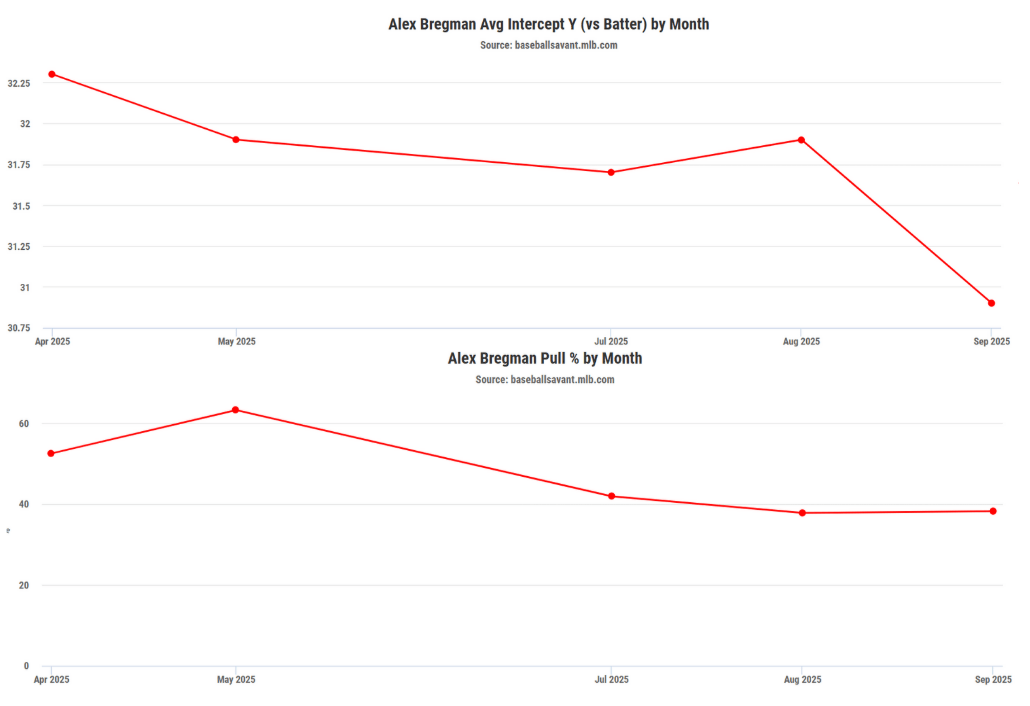
Alex Bregman Y-contact point and pull% by month, 2025 (Statcast)
Patterns that mirrored each other this closely weren’t going to get past smart people like Nick and Kyle. A million-dollar question – or $175M, if you’re the Cubs – then emerged from this discussion: Did Bregman’s bat speed tangibly drop? Or was that a byproduct of where he was making contact in the later months of the season?
There is growing research that suggests collinearity between the two. Eno Sarris of The Athletic delivered a presentation at the annual First Pitch Arizona fantasy baseball conference back in November, concluding that swing speed accelerates throughout the bat path, meaning that batters who catch the ball out front more often are bound to have higher bat speeds (you’ll have to take Nick’s word for it; I regrettably wasn’t there). MLB’s play-by-play data doesn’t have enough points to make such a claim directly, but it’s a pretty easy theory to back up when looking at league averages for bat speed and contact point by hit direction.
Average Bat Speed and Contact Point by Hit Direction, 2023-25
Or, better yet, take a look at the graph below, which illustrates how bat speed and contact point have both risen fairly simultaneously since MLB started tracking them.
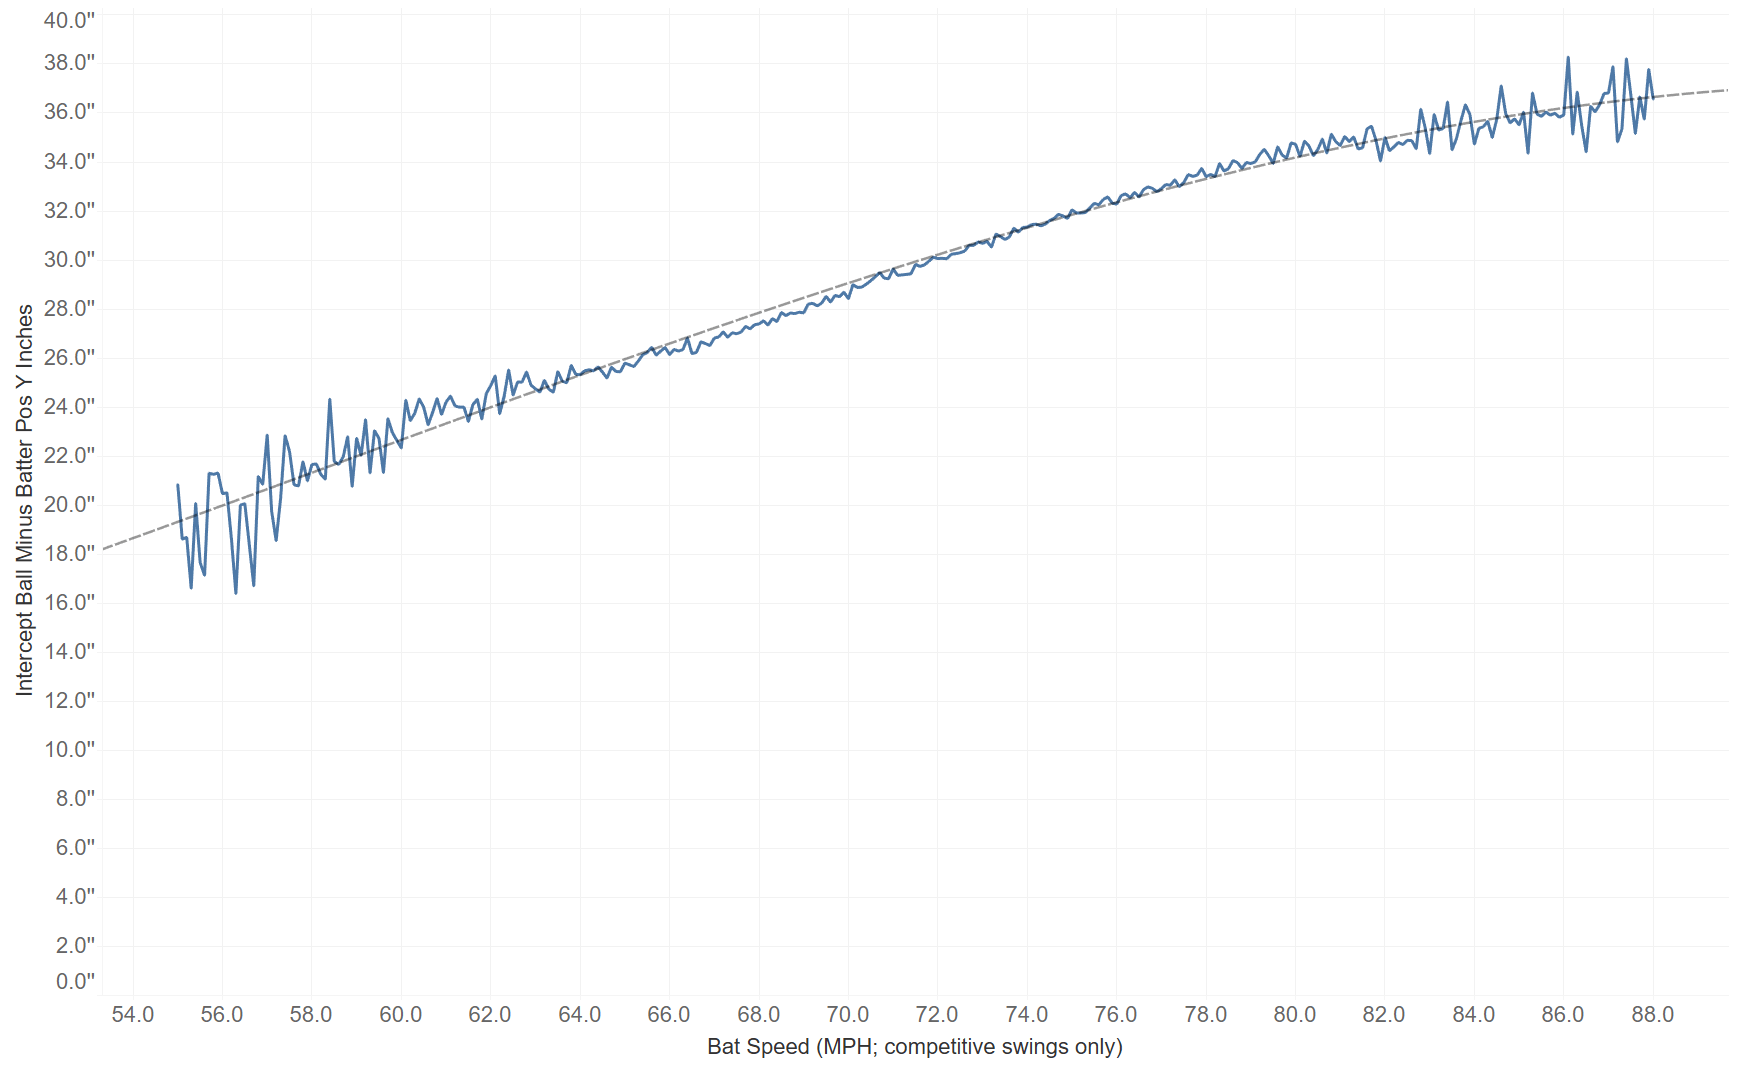
Average Y-contact point at each interval of bat speed, 2023-25 (Statcast)
The R² of the line of best fit is 0.98. If we can predict that the contact point will rise with bat speed to this degree of accuracy, why shouldn’t we measure bat speed independently of it? Plenty of indicators signal a strong connection between the two variables, to the point that bat speed relative to contact point, or hit direction, seems to be a more powerful explanation of a hitter’s raw power than raw bat speed averages on their own.
Let’s look at an example of why this is perhaps a more accurate way of interpreting bat speed: Juan Soto. We know that bat speed declines precipitously after age 31. Soto’s only 27, but the megadeal he signed with the Mets just over a year ago will keep him in Queens way past that. Some minor alarm bells sounded when his average bat speed declined from the 94th percentile to the 72nd percentile in just the first year of that contract. Sure, his SLG and OPS declined by about 45 and 70 points, respectively, but the drop in his propensity for power was not nearly as substantial as raw average bat speed would indicate because he let the ball travel more (he still recorded an OPS above .900 for the third year in a row).
Juan Soto Bat Speed and Contact Point, 2024 vs 2025
The same logic can be applied to those who experienced substantial gains in their average bat speed last year compared to the year before. One such example is Toronto’s Addison Barger. He has always been dripping with strength and raw pop, and significantly improved on his rookie year by overhauling his stance and adding a few ticks to his bat speed, which was a key source of value to begin with. Measuring bat speed relative to the contact point shows that this was not the result of some newfound strength so much as a concentrated effort to catch the ball farther in front of home plate. He had one of the most pronounced year-over-year changes in contact point since the bat tracking era, still in its relative infancy, began.
The same applies, to a lesser extent, to Vinnie Pasquantino. His bat speed shot way up from 2024 early this past season before tapering off down the stretch, but still wound up as a ~1 MPH improvement from the year before. He clobbered a career-high 32 home runs and is more similar to Bregman than Barger is as a hitter in that he relies more on starting his swing early and lifting the ball to his pull side, although each of them has a flatter-than-average bat path. Pasquantino, like Bregman, pairs that with above-average bat-to-ball skills to provide solid production without gaudy bat speed or exit velocities. His contact point nudged closer to the pitcher along with the minimal bat speed increase, again reflected by the even smaller increase in bat speed above average.
In contrast, the hitter who increased his bat speed the most in the league between 2024 and 2025 was Milwaukee’s Brice Turang, who became a solid offensive contributor for the first time in his career. His average bat speed went from the second to the 27th percentile, which doesn’t seem that impressive until you realize it was a jump of nearly five MPH. The big catch here? His contact point barely shifted at all.
With what we’ve now established about how these data points depend on each other, this is far more significant than, say, if he experienced a similar increase in bat speed while catching the ball four inches farther out front. Turang has one of the most opposite-field-oriented swings in the game and solid plate skills, so going from second percentile to moderately below-average bat speed indicates he gained layers upon layers of strength over the offseason. Of course, minor regression with respect to his swing-and-miss and strikeout rates was the tradeoff, but he still hit .288 and was the best he’d ever been with the bat. Perhaps he could be a blueprint for guys with a knack for contact or discipline looking to find another gear offensively.
So, what does this all mean for Bregman? He may be as well-known a pull-air guy as there is, but he doesn’t make contact abnormally far in front of the plate like you might expect, instead timing it up so that his slightly flat swing is still positioned for loft, as evidenced by his well-above-average 14° attack angle. At the end of his short time in Boston, here’s how the two-year window looks:
He lost a fraction of bat speed despite a shallower contact point – certainly not a trend that Cubs fans are hoping to see continue. Of course, there’s more to the story: He has excellent contact-ability and a great eye, so he can be of service offensively without slugging as much as he has been. Furthermore, while his swing intuitively fits Fenway better than Wrigley, he has called Houston and Boston, the two most righty-hitter-pulled-flyball-friendly parks in the league, home for his entire career up to this point, and his road OPS slightly exceeds his home OPS as of now. Statcast’s expected home runs by park feature also tabbed him for 19 round-trippers had he played his home games in Chicago, compared to 16 in Boston (he hit 18 in reality). He might not register an OPS over .800 at any point during this contract, but he can do more than one thing well offensively and plays a fine third base, slotting into an infield that already boasts Dansby Swanson and Nico Hoerner up the middle.
Bregman taking his talents from one storied franchise to another is an interesting launching point for how bat speed and contact depth intersect. Entering the third season of bat tracking data being available on Baseball Savant, these two figures are evidently strongly tied together and should be interpreted with that taken into account. I expect more mainstream use of bat speed relative to contact point in the coming months, and the work done by sabermetricians to diagnose that connection is one of the more consequential discoveries made about quantifying hitting mechanics so far.