
Hi everyone,
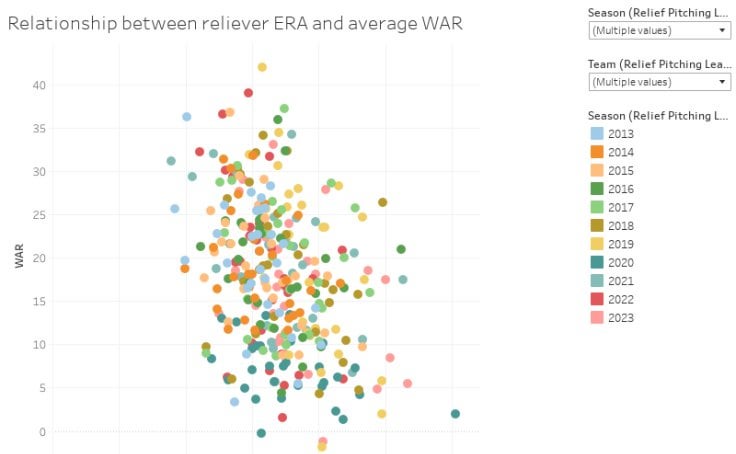
I’m upskilling in Tableau and after lamenting how bad my Texas Rangers’ relievers are this year, figured I’d create this fun visual to determine whether there’s a relationship between team WAR and relief pitcher ERA.
I would’ve used a team’s actual wins, but they strangely aren’t exportable in Fangraphs (so if someone can point me to a data source that has this, it’d be much appreciated)!
The default view has all ten years of data, with each dot representing a single team’s season (e.g. Dodgers 2019).
Cluster analysis isn’t available in Tableau Public unfortunately, which would make breaking down 10 years worth of data a lot easier to analyse.
However, if you use the filters on the right to break it down year by year, trends are easier to see.
Using 2023 as an example, you can see that there’s a medium correlation between WAR and pitcher relief era, with teams such as my Rangers being the most notable high WAR/high ERA outlier and the Brewers being the most notable low ERA/low WAR outlier.
Anyway, this is my first time doing this so please be gentle, and hope you all enjoy 😊.
I’ve also got paid for a year’s worth of Fangraphs, so if anyone has any requests using Fangraphs data, let me know and I’ll do my best to try and build it!
1 comment
Fangraphs has team W/L on the team pitching table:
https://www.fangraphs.com/leaders/major-league?pos=all&stats=pit&lg=all&qual=0&type=8&season=2023&month=0&season1=2023&ind=0&team=0%2Cts&rost=0&age=0&filter=&players=0&sortcol=2&sortdir=desc&pagenum=1
Just make sure you’re not filtering starting/relief pitchers.