
Visiting Habs fan here! I built a tool to create these cumulative performance charts and decided to make one for every NHL team before the start of the season.
I originally created this for my baseball team, the Pirates, who hit a franchise milestone this season – reaching exactly .500 (10,879-10,879) on July 19th for the first time since 1903. I wanted to visualize the incredible downward spiral back to 0.500 (for those interested: Pirates chart), and it turned out so compelling that I decided to bring the concept to my second favorite sport: hockey.
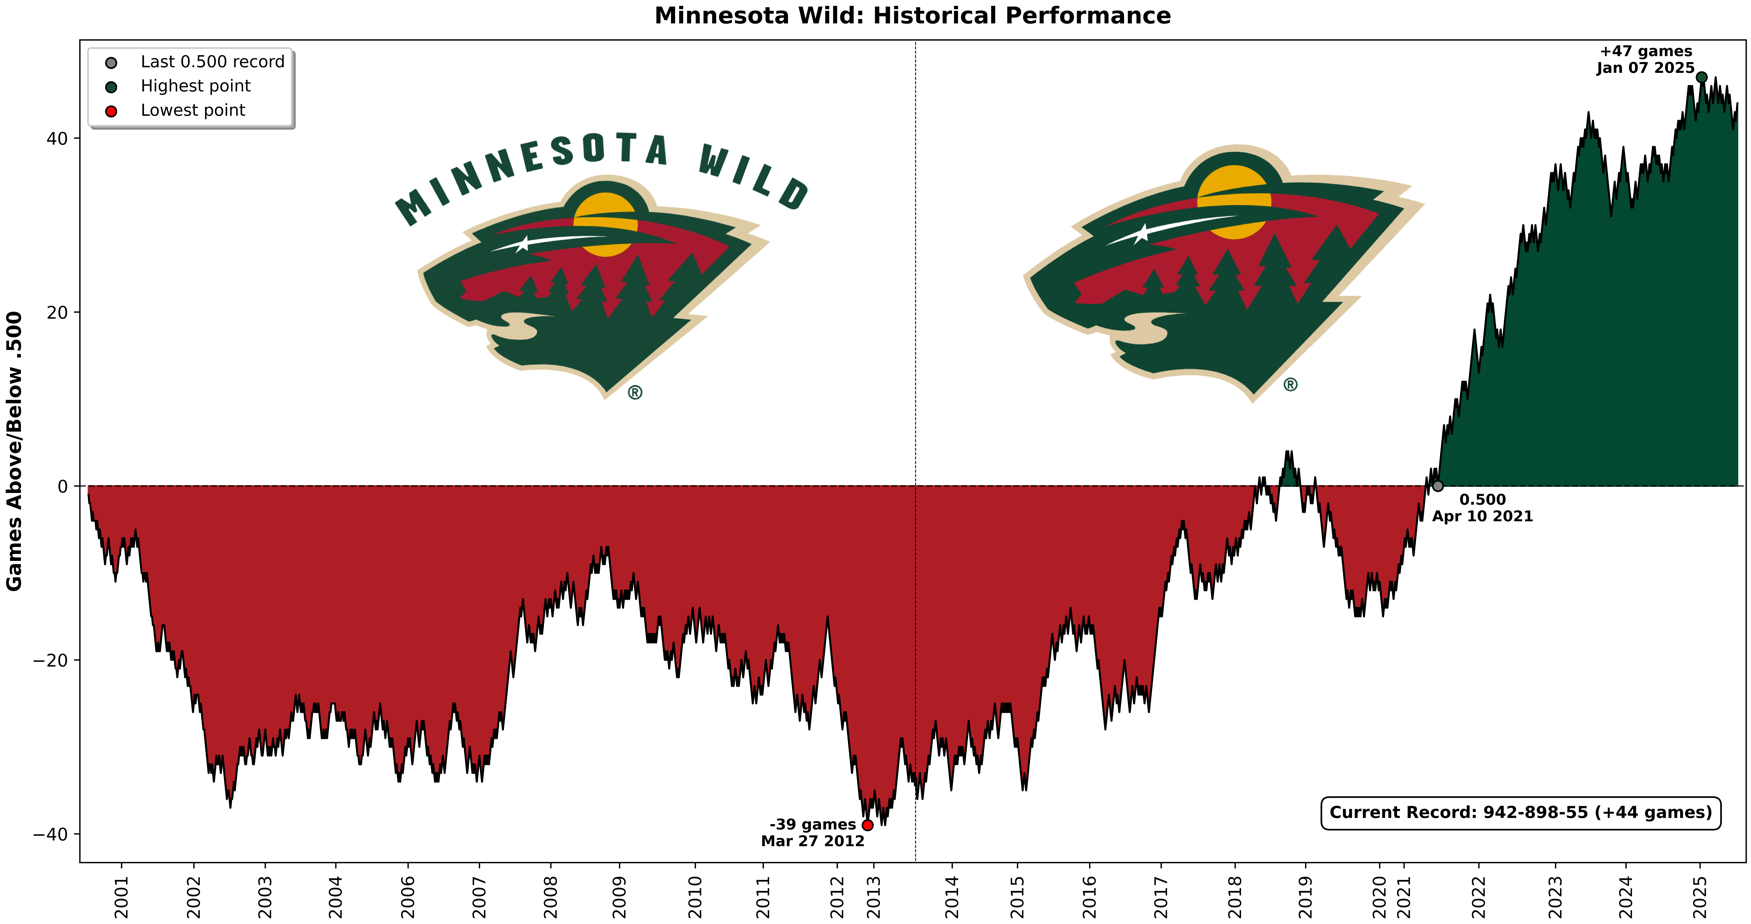
Technical note: Each win (regulation or OT) moves the line up +1, each loss (regulation or OT) moves it down -1, and ties keep the value unchanged. The dotted vertical line show a logo change.
6 comments
Looks like relative to the others you’ve done ours is practically a flat line, which seems accurate.
I know Kaprizov has a lot to do with this.. but you people that complain about Guerin need to shut the fuck up. We’ve had nothing but fun and exciting regular seasons since he became our GM while we were literally projected to be bottom feeders the entire time paying those Parise and Suter buyout penalties.
You can complain about playoff success all you want, but we SHOULD NOT have ever even made them to begin with for the last 5 years.
The time is coming lads.
As a Wisconsin Native I chose not to support a team till later in life. So none of those seasons till I came on board count. And since I’ve become a fan the team is more and more promising.
On the one hand, we’re in the best of times ever in franchise history. On the other hand, Jesus Christ
This is really cool, and I’ve been looking at the others you have posted to teams’ subreddits. I cannot tell you how happy the Blackhawks chart makes me.
Interesting data.
Now please come up with a chart that shows when the Wild will actually win the Stanley Cup.
25 years and still waiting. Lol.