
Visiting Habs fan here! I built a tool to create these cumulative performance charts and decided to make one for every NHL team before the start of the season.
I originally created this for my baseball team, the Pirates, who hit a franchise milestone this season – reaching exactly .500 (10,879-10,879) on July 19th for the first time since 1903. I wanted to visualize the incredible downward spiral back to 0.500 (for those interested: Pirates chart), and it turned out so compelling that I decided to bring the concept to my second favorite sport: hockey.
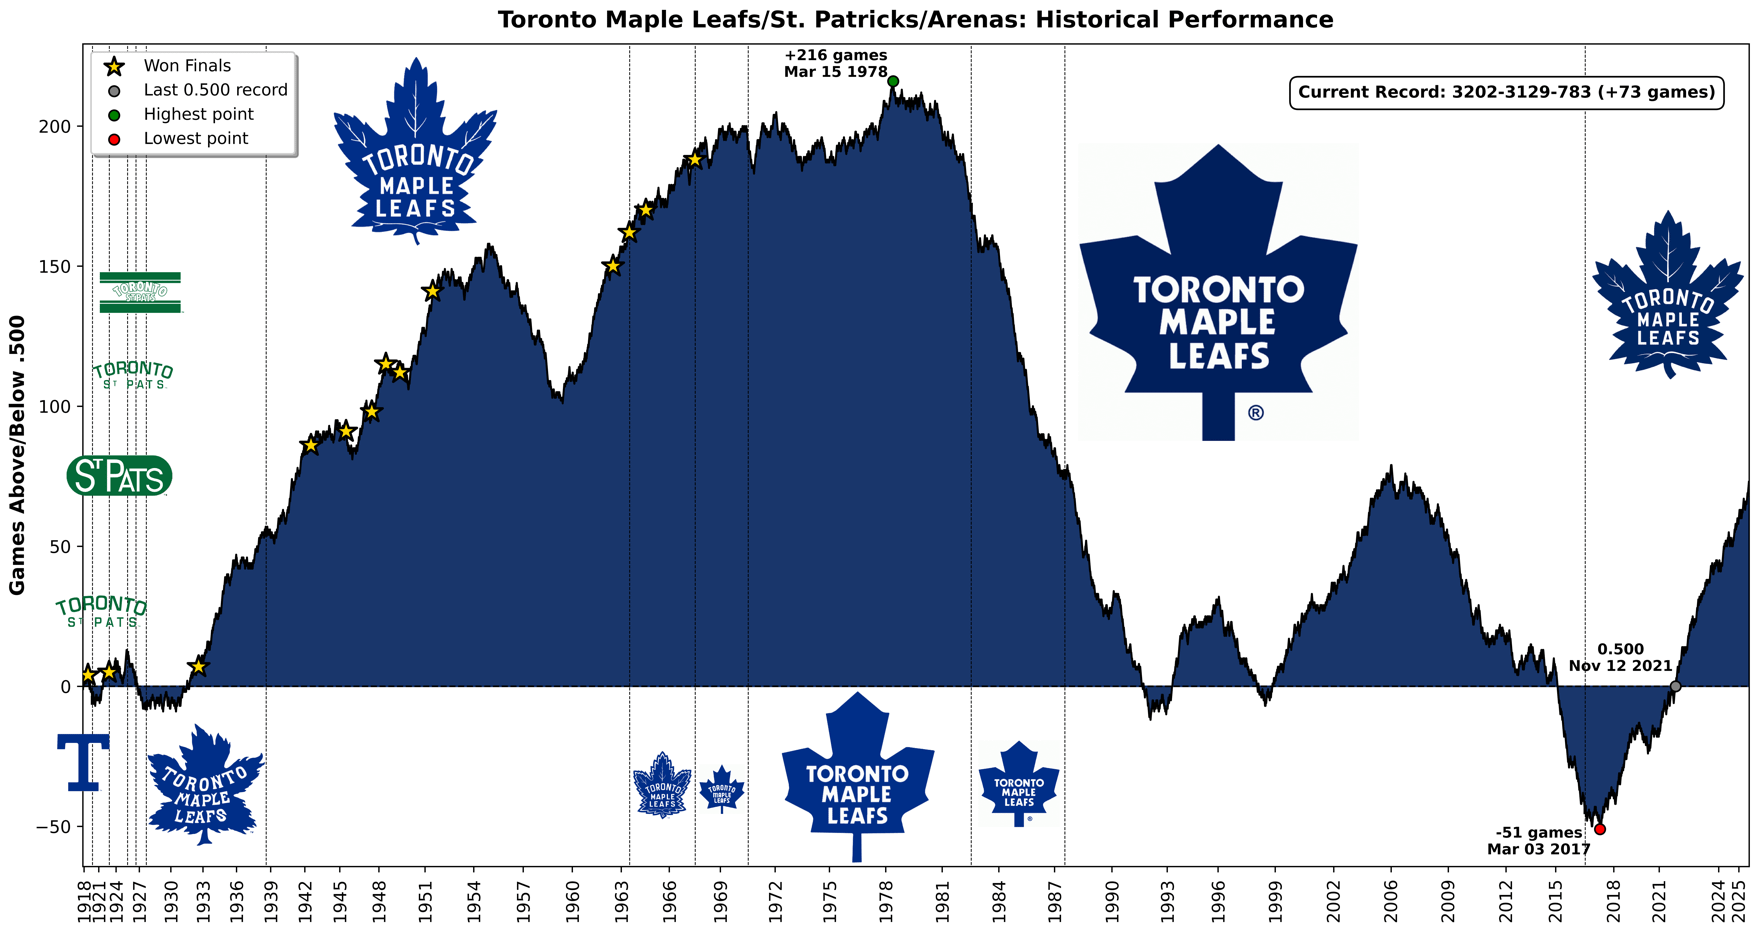
Technical note: Each win (regulation or OT) moves the line up +1, each loss (regulation or OT) moves it down -1, and ties keep the value unchanged. Vertical full line shows relocation, and vertical dotted lines show a logo change.
6 comments
Thanks for the info!
It seems that we’re trending up the right direction, hopefully continues upwards and mimics our trend in the 60s
Nearing the end of this competitive window, if it takes another 11 years to rebuild again I’m gonna lose my shit.
Anyone born in the 70s till now, you’ve known nothing but pain with a few glimpses of relief.
Someone wasted a lot of time tracking useless nonsense here 😂
Fuck Harold Ballard, holy shit did he ever just tank such a storied and richly successful franchise.
Kinda cool to see. Makes sense given what I’ve been through as a leaf fan…