Yes I did tax this from the NFCWest Meme War page. Didnt see it posted here, wonder how much is a product of a bad run game and subpar line play.

Yes I did tax this from the NFCWest Meme War page. Didnt see it posted here, wonder how much is a product of a bad run game and subpar line play.
8 comments
Matches the eye test.
> wonder how much is a product of a bad run game and subpar line play.
This sub is in peak form not blaming the highest paid player on the team for a bad passing game.
Years of mediocre play in the pass game with only one consistent person and people still don’t fault him for it.
Most of it has been the line/run game. I do wonder the change in that sack number if the 3 “sacks” murray took by going down /out of bounds one yard behind the line are actually in front
The O-Line has been a historical problem forever
i used to sit by a guy that would say a QB had happy feet when they were scared of staying in the pocket. it’s very fitting for kyler at times.
also 1/3rd of those are self sacks with kyler running out of bounds 2 yards behind the line that most QB’s would put in first row before going out.
It’s easy to see from the first 2 games of the season, this team is not as explosive as it should/could be. We had 2 very close games against bottom tier teams and Kyler still looks inconsistent
I wanna see this along with time before the pocket collapses.
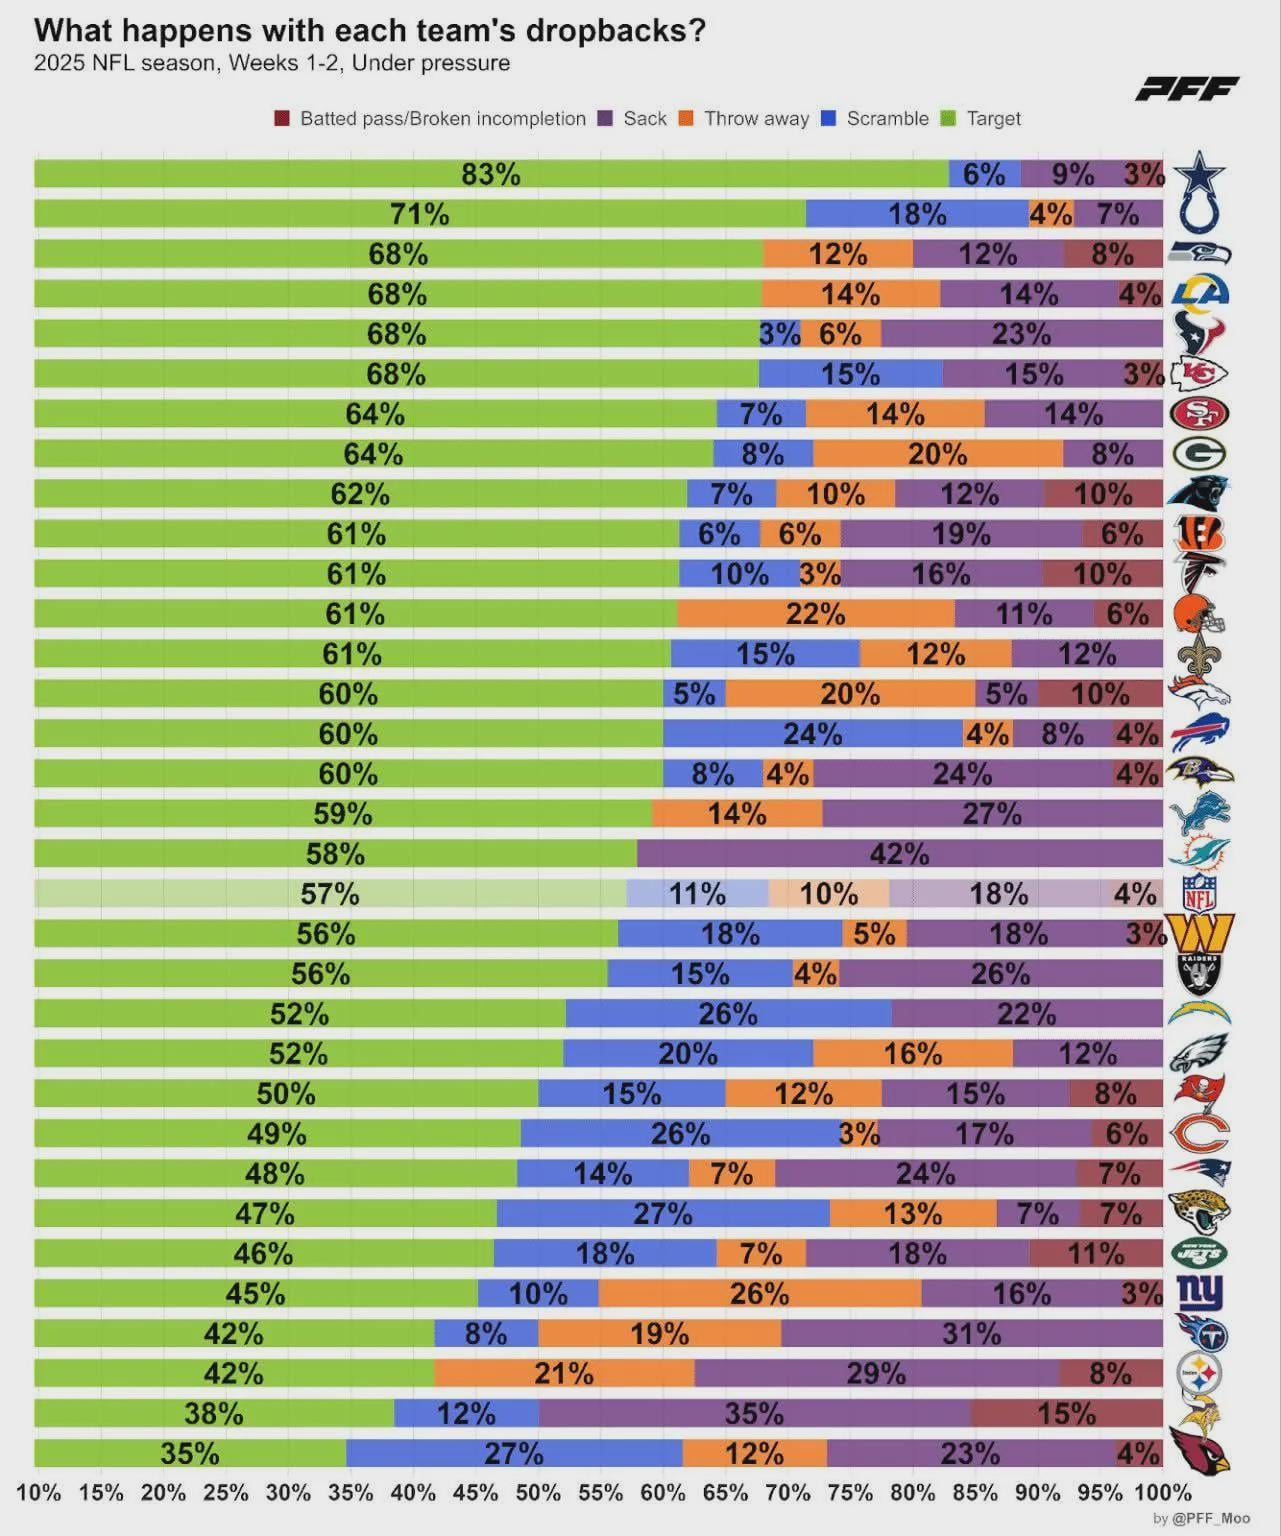
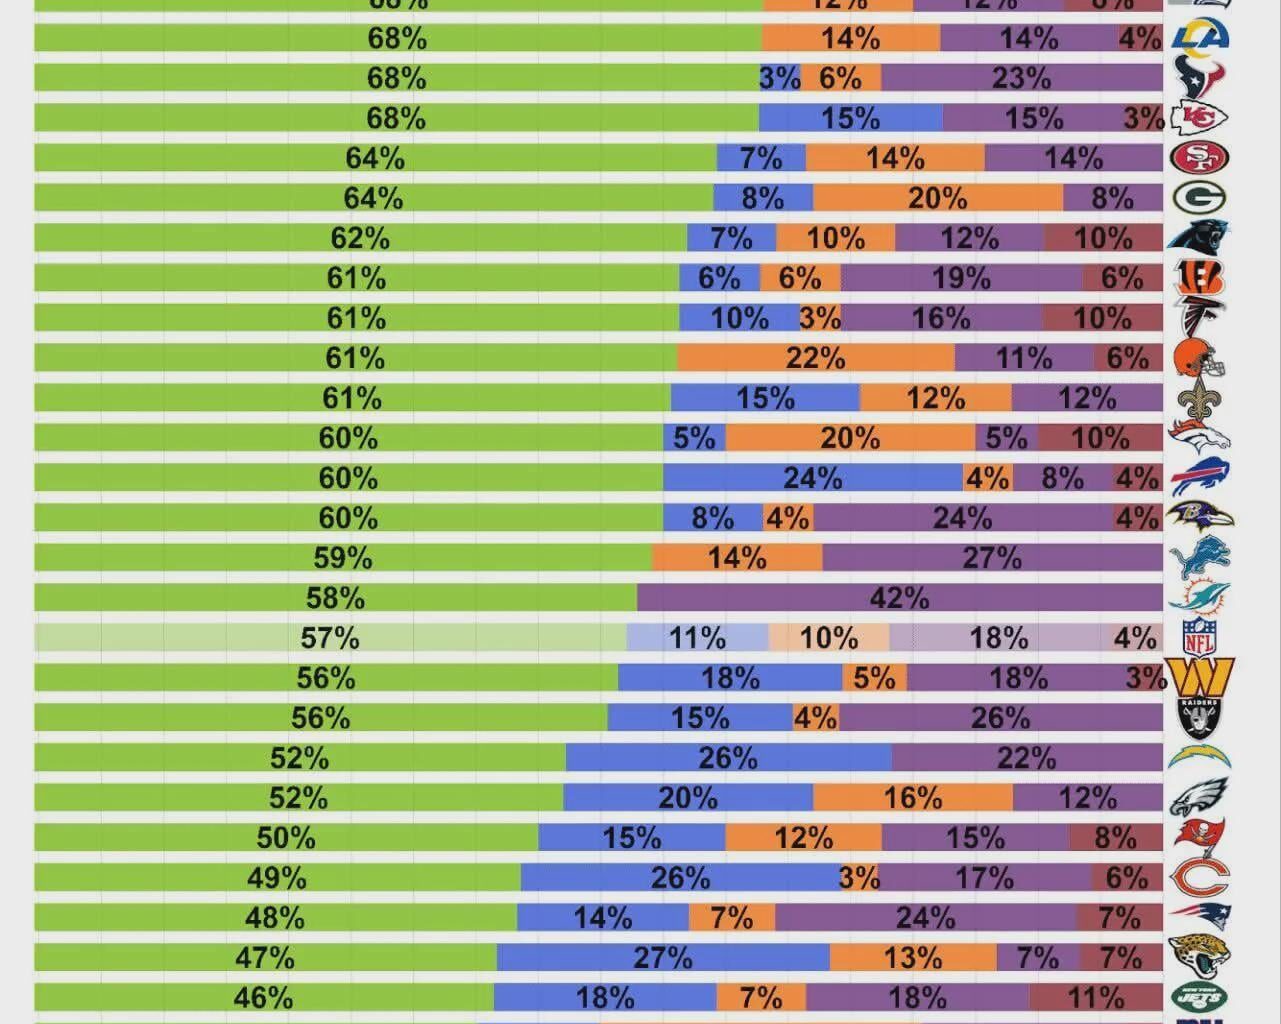
Title of the graph and parameters of the graph are misleading. This is specifically when the quarterback is under pressure, not on every dropback
Exactly what are we supposed to take from this graph? Houston has had arguably the worst offense in the league and they are four from the top of this graph. In fact, quite a few teams that have had objectively worse offense than the Cardinals so far are well above the Cardinals.