
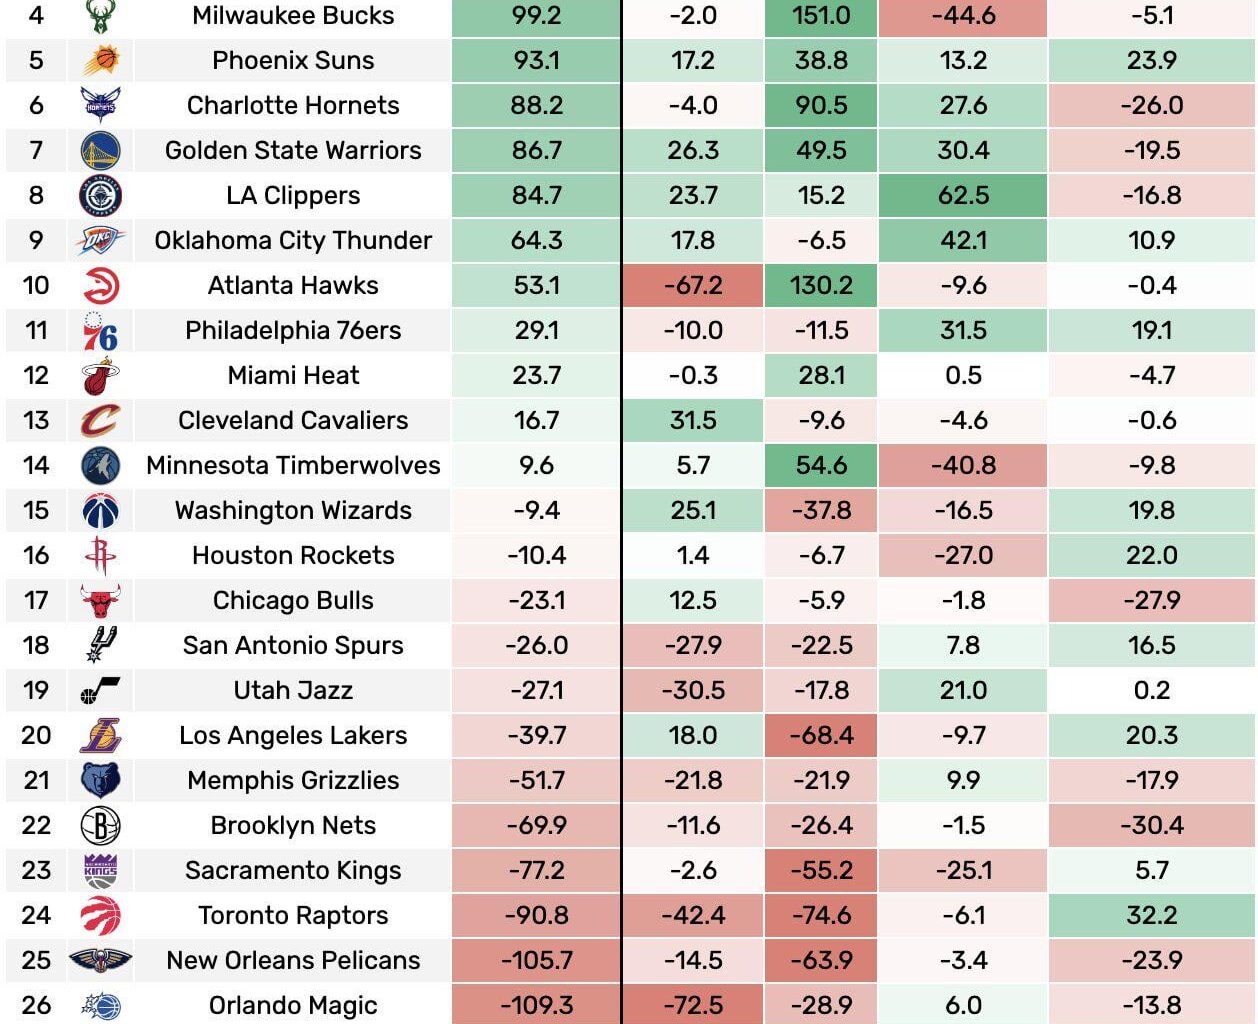
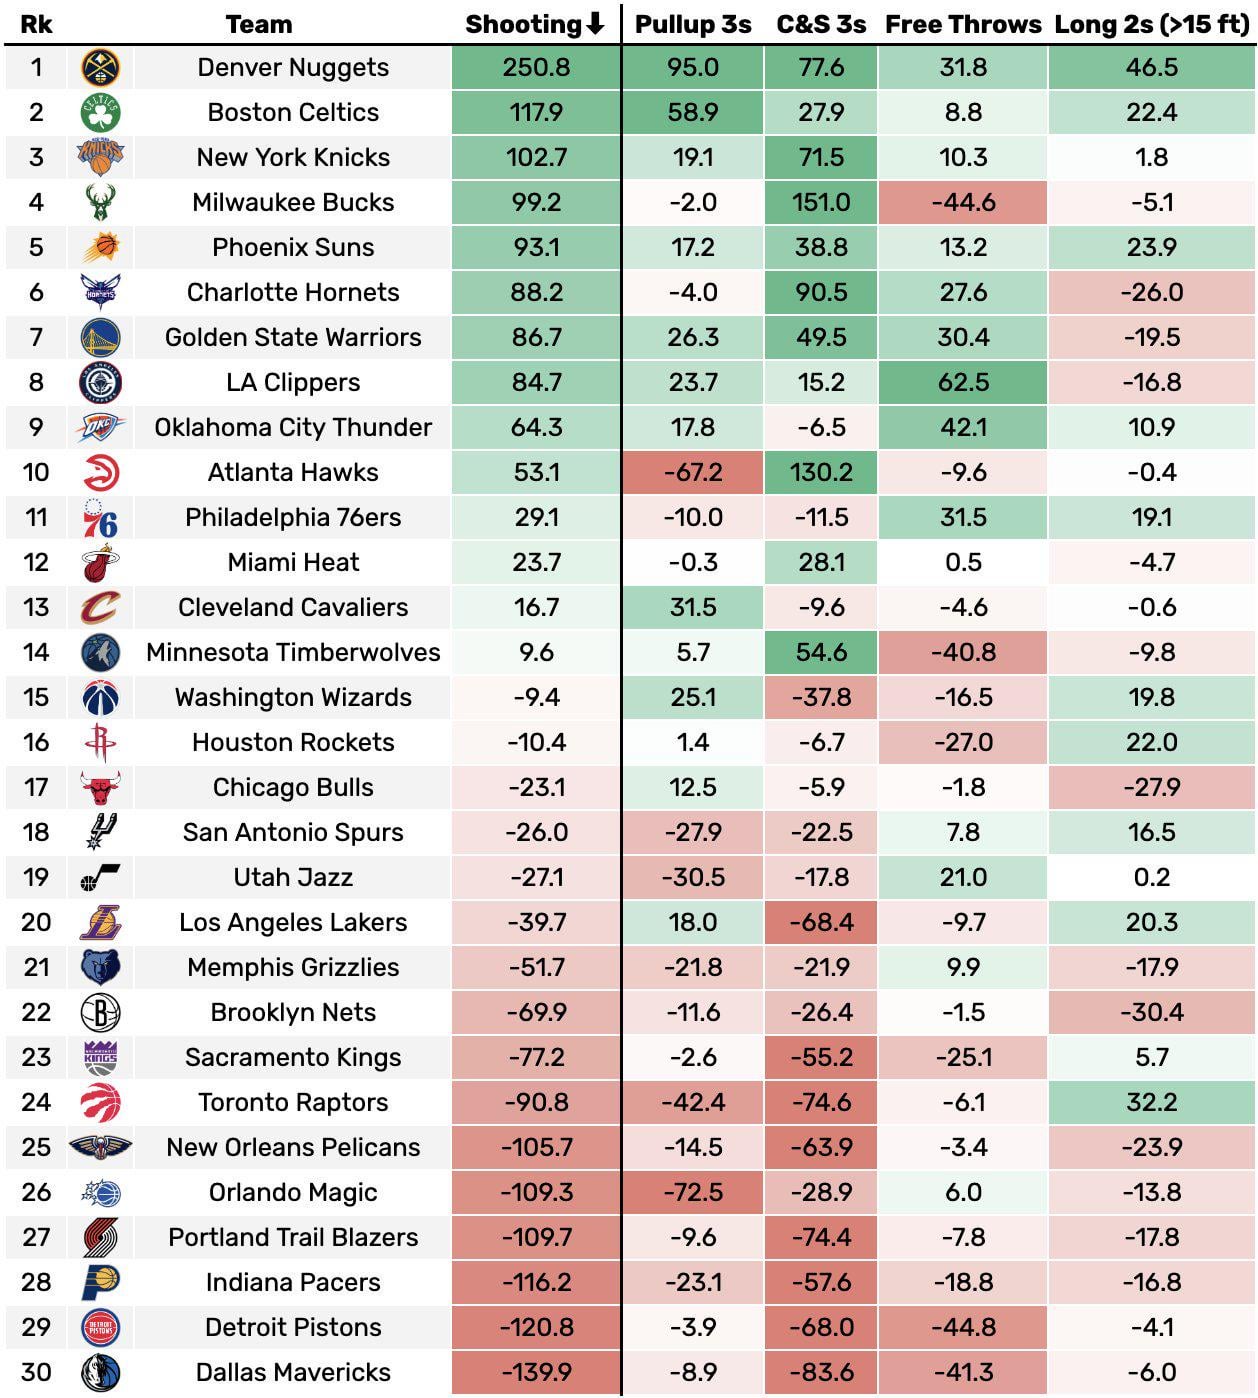
Calculated by how many points they added above league average on these specific shots. For example if the league average 3pt is 38%, and a player shoots 44% having attempted 300 threes this season so far, they would have made 132 threes so far and scored 396 points, when a league average player would be expected to make 114 threes and score 342 points. This graph ranks how many points entire rosters generated above what would be expected on these shots.