
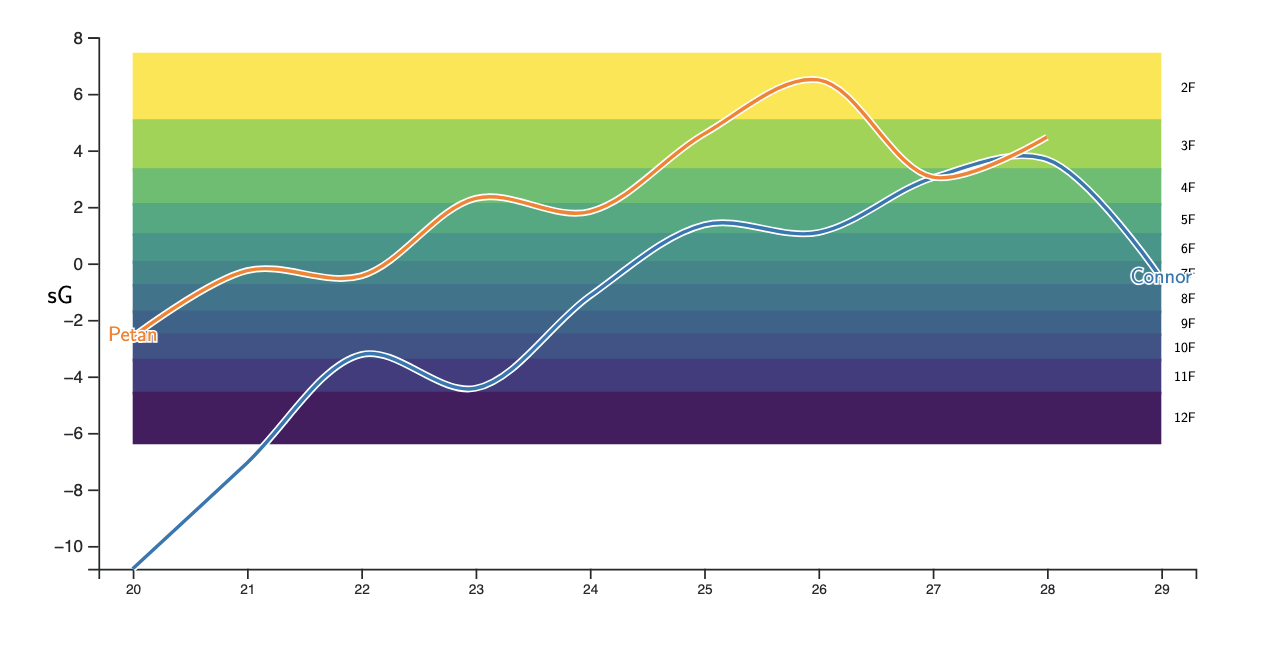
This is the sG model (synthetic goals)…
It looks at player performance levels by combining multiple different things:
- Finishing
- Setting
- Offensive transition
- 5v5 offensive chance generation (expected Goals)
- Power play offensive chance generation (expected Goals)
- Penalty drawing
- Penalty taking (or lack there of)
- 5v5 defensive chance prevention (expected Goals)
- Penalty kill defensive chance prevention
It adjusts all of these based on usage factors (who you play with, against, zone starts, game trailing/leading, etc.) but also prorates everyone to the exact same baseline of ice time deployment.
Enjoy.
4 comments
I was expecting the Ehlers vs. Connor chart, and nearly had a conniption fit when I saw who the orange line was actually modelling
https://preview.redd.it/jskl6wfltxjg1.jpeg?width=320&format=pjpg&auto=webp&s=7e6bd40f0d6f8d12a3578605f0407d4b3cab5983
I appreciate that you haven’t expanded speculatively on this presented data. It could be something for everyone:
— Petan-truthers were right
— Connor is no good
— analytics are garbage
— analytics are nuanced, not monolithic
— environment and context matter
— nothing matters, god is dead
— cats and dogs are different and it doesn’t matter
— cats could be dogs with different deployment
— cats shouldn’t be forced to be dogs, let people enjoy things
— etc
A true firecracker, and a true vacuum of context.
I’d rather just watch hockey games, thx.