
The start of this road trip hasn’t gone to plan so far. Any series in New York is going to be difficult, but the silly mid-inning rain delay on Tuesday and the complete collapse of the Mariners bullpen on Thursday made this particular trip to the Bronx especially bitter. Things won’t get any easier this weekend — series in Detroit have seemed to be cursed for the Mariners in recent seasons. The All-Star break couldn’t come any quicker.
At a Glance
Mariners
Tigers
Mariners
Tigers
Game 1
Friday, July 11 | 4:10 pm
RHP Luis Castillo
LHP Tarik Skubal
38%
62%
Game 2
Saturday, July 12 | 10:10 am
RHP George Kirby
RHP Casey Mize
53%
47%
Game 3
Sunday, July 13 | 10:40 am
RHP Logan Gilbert
RHP Jack Flaherty
53%
47%
*Game odds courtesy of FanGraphs
Team Overview
Overview
Tigers
Mariners
Edge
Overview
Tigers
Mariners
Edge
Batting (wRC+)
110 (3rd in AL)
111 (2nd in AL)
Mariners
Fielding (OAA)
2 (5th)
-11 (11th)
Tigers
Starting Pitching (FIP-)
88 (2nd)
104 (8th)
Tigers
Bullpen (FIP-)
97 (9th)
107 (13th)
Tigers
If you believed in the hot streak that earned the Tigers a surprise playoff berth last year, then their ascent to the top of the AL standings this year might have been expected. If we’re being honest, this kind of success for Detroit has been just as surprising as their postseason appearance in 2024. The key hasn’t been guys like Tarik Skubal or Riley Greene ascending to superstardom — of course it helps, but they were superstars last year. The biggest reason why the Tigers have been so successful is because nearly all of the role players on their roster have hit their 90th percentile projections and the young prospects who had trouble acclimating to the majors last year have finally figured it out. Combined with a fully functional starting rotation and a deep and flexible bullpen, the Tigers look like one of the most complete teams in the majors right now.
Tigers Lineup
Player
Position
Bats
PA
K%
BB%
ISO
wRC+
Player
Position
Bats
PA
K%
BB%
ISO
wRC+
Colt Keith
DH
L
282
19.5%
11.0%
0.178
125
Gleyber Torres
2B
R
346
12.7%
14.2%
0.142
129
Riley Greene
LF
L
385
31.9%
7.0%
0.245
138
Spencer Torkelson
1B
R
370
23.8%
11.4%
0.263
130
Wenceel Pérez
RF
S
132
21.2%
6.1%
0.264
129
Zach McKinstry
3B
L
319
21.9%
9.7%
0.182
131
Dillon Dingler
C
R
258
23.6%
3.5%
0.148
100
Parker Meadows
CF
L
110
28.2%
9.1%
0.100
63
Javier Báez
SS
R
276
22.1%
3.3%
0.172
112
The Tigers have four All-Stars in their lineup; three were completely deserving selections and the third was … the beneficiary of the fan voting system. Javier Báez’s resurgence this year has been a great story, but starting All-Star center fielder feels like a bridge too far. As for the other All-Stars, Greene really elevated his production last year and has been ever so slightly better this year. The shape of his production looks a little different, however; he’s gotten a lot more aggressive in his swing decisions, and while his high quality batted ball metrics have buoyed him, his strikeout and walk rates have both trended the wrong way. Gleyber Torres is in the middle of the best season of his career after leaving the bright lights of New York and is on his way to the All-Star game for the first time since 2019. The most surprising All-Star in this lineup has been Zach McKinstry. He was a perfectly serviceable utility man for the past few years, but all of a sudden, he’s added 60 points to his ISO and nearly 100 points to his BABIP and now he’s putting up a 131 wRC+. Beyond those four All-Stars, the Tigers have really benefitted from long-awaited breakouts from Spencer Torkelson and Colt Keith.
Probable Pitchers
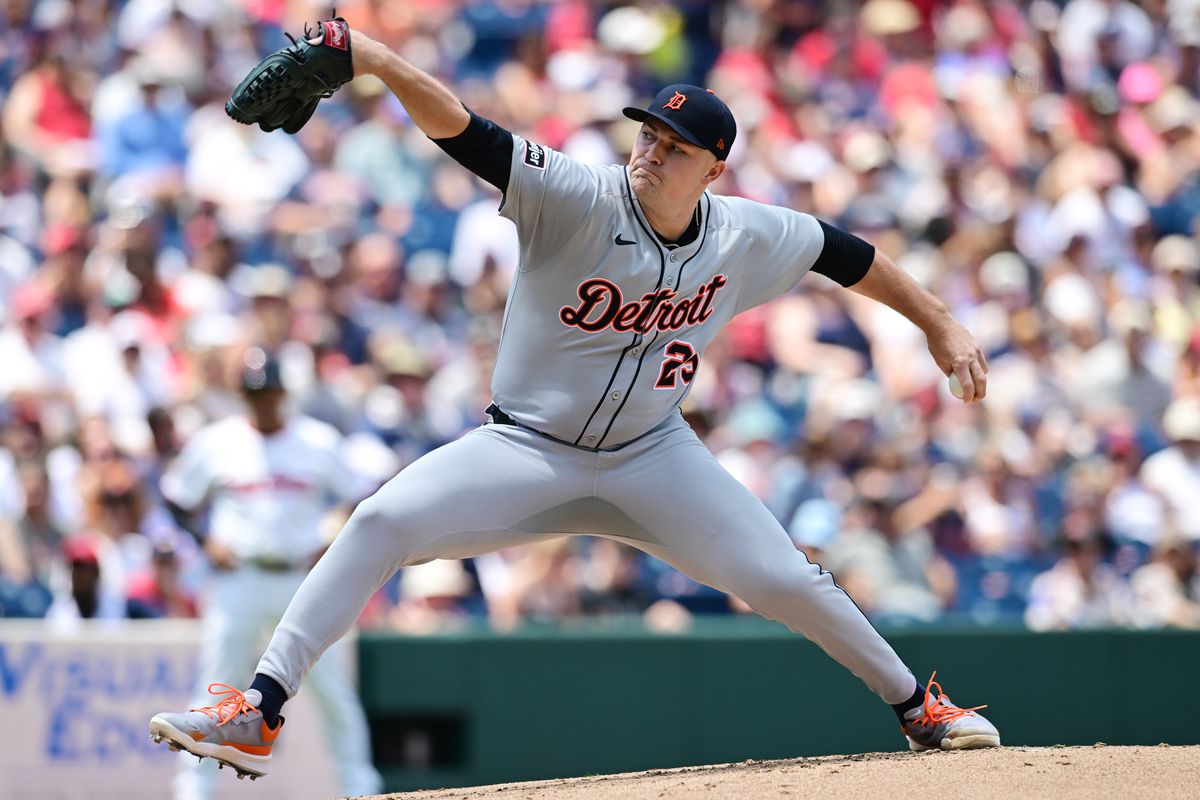
Ken Blaze-Imagn Images
Game 1 Pitching Matchup
Pitcher
IP
K%
BB%
HR/FB%
GB%
ERA
FIP
Pitcher
IP
K%
BB%
HR/FB%
GB%
ERA
FIP
Tarik Skubal
116
33.9%
3.2%
7.8%
42.1%
2.02
1.87
Luis Castillo
103.1
20.2%
7.4%
9.6%
41.2%
3.31
3.90
LHP Tarik Skubal
Pitch
Frequency
Velocity
Stuff+
Whiff+
BIP+
xwOBA
Pitch
Frequency
Velocity
Stuff+
Whiff+
BIP+
xwOBA
Four-seam
26.8%
97.6
116
129
92
0.307
Sinker
26.3%
97.3
110
150
122
0.282
Changeup
31.7%
88.3
124
158
122
0.166
Curveball
2.4%
81.1
Slider
12.9%
89.6
115
74
81
0.317
From a previous series preview:
Tarik Skubal was the unanimous winner of the AL Cy Young award last year, completing his ascent into the echelons of the best pitchers in baseball. Sure, he has a fastball that can hit triple digits, a rarity from the left side, but the real reason why he’s so dominant is because his repertoire is as complete as you can get. Each of his pitches plays well off his heater so that a batter rarely has any idea what pitch is incoming until it’s too late. Against righties, it’s a nasty changeup that ran a 46% whiff rate last year. Against lefties, it’s a hard, biting slider that ran a 34% whiff rate. He’s also got a sinker and curveball to deploy when he needs to mix things up, and his command is so good that he can dot any of those pitches wherever he wants. He really does have the complete package for an ace pitcher.
Skubal is easily the favorite to win the AL Cy Young award but the Mariners somehow managed to hand him one of his two losses on the season back on April 2. They scored three runs in 5.2 innings, handing him one of his worst starts of the season.
Game 2 Pitching Matchup
Pitcher
IP
K%
BB%
HR/FB%
GB%
ERA
FIP
Pitcher
IP
K%
BB%
HR/FB%
GB%
ERA
FIP
Casey Mize
85.2
20.7%
5.9%
10.1%
40.7%
2.63
3.78
George Kirby
49
25.1%
4.5%
14.0%
43.5%
4.22
3.57
RHP Casey Mize
Pitch
Frequency
Velocity
Stuff+
Whiff+
BIP+
xwOBA
Pitch
Frequency
Velocity
Stuff+
Whiff+
BIP+
xwOBA
Four-seam
32.8%
94.5
93
94
89
0.317
Sinker
12.2%
94.6
102
72
99
0.357
Splitter
26.6%
88.7
101
83
99
0.270
Slider
12.6%
87.4
82
58
68
0.261
Slurve
15.7%
83.2
99
98
98
0.209
From a previous series preview:
At one point, Casey Mize was one of the best pitching prospects in all of baseball, but injuries have held him back from making good on all that promise. He struggled upon his first taste of the big leagues and then missed almost all of 2022 and the following season after undergoing Tommy John surgery. He returned to the mound mostly healthy last year and looked a little better than he had earlier in his career. His fastball was a little harder, his splitter was looking sharper, but he still lacked the true swing-and-miss offering to push his arsenal to the next level.
Mize’s first start of the year came against the Mariners and he held them scoreless over 5.2 innings. That got his season off on the right foot and he hasn’t looked back since. His ERA is well under three, and even though he still hasn’t found a true swing-and-miss weapon, his trio of secondary offerings has worked well to suppress hard contact against him.
Game 3 Pitching Matchup
Pitcher
IP
K%
BB%
HR/FB%
GB%
ERA
FIP
Pitcher
IP
K%
BB%
HR/FB%
GB%
ERA
FIP
Jack Flaherty
95.2
29.3%
9.5%
15.3%
34.4%
4.70
4.23
Logan Gilbert
55.2
35.1%
5.8%
18.0%
41.5%
3.88
3.16
RHP Jack Flaherty
Pitch
Frequency
Velocity
Stuff+
Whiff+
BIP+
xwOBA
Pitch
Frequency
Velocity
Stuff+
Whiff+
BIP+
xwOBA
Four-seam
46.4%
92.8
102
79
88
0.369
Sinker
2.1%
90.5
Changeup
3.0%
85.7
Curveball
25.9%
77.5
107
147
95
0.192
Slider
22.6%
84.4
90
92
89
0.378
Jack Flaherty was enjoying a resurgent season in Detroit last year and then they traded him to the Dodgers at the trade deadline. After winning a championship in Los Angeles, he re-signed with the Tigers this offseason on a two-year deal. Things haven’t gone as well in his second stint with the ballclub. His strikeout rate has looked good, but his walk rate has increased by more than four points. Flaherty has always struggled with the feel for his breaking pitches, and right now, he isn’t locating them very well. That’s allowed opposing batters to key in on his fastball. The result is an ERA approaching five even though his peripherals paint a picture that’s a little better than that.
The Big Picture:
AL West Standings
Team
W-L
W%
Games Behind
Recent Form
Team
W-L
W%
Games Behind
Recent Form
Astros
55-38
0.591
—
W-W-L-L-L
Mariners
48-45
0.516
7.0
W-W-L-L-L
Rangers
46-48
0.489
9.5
L-L-W-L-W
Angels
45-48
0.484
10.0
L-W-L-W-L
Athletics
39-56
0.411
17.0
L-L-W-L-W
AL Wild Card Standings
Team
W-L
W%
Games Behind
Recent Form
Team
W-L
W%
Games Behind
Recent Form
Yankees
52-41
0.559
+3.0
L-W-W-W-W
Rays
50-44
0.532
+0.5
W-L-L-W-L
Red Sox
50-45
0.526
—
W-W-W-W-W
Mariners
48-45
0.516
1.0
W-W-L-L-L
Not only did the Mariners squander an opportunity against a direct Wild Card rival, they couldn’t make up any ground in the AL West either after the Astros were swept by the Guardians earlier this week. Houston will host the Rangers this weekend after Texas split its four-game series against the Angels. In the Wild Card race, the Red Sox have surpassed the M’s in the standings by winning seven games in a row. Boston started off a huge four-game set against the Rays with a victory yesterday.