
NPB reconstitution
10 mg of NPB powder (from either Pandey et al. authors2 or Axon Medchem cat# 3079, batch# 1) was diluted in 380 μL of DMSO (Sigma-Aldrich cat# 472301) for a stock concentration of 50 mM. The reconstituted NPB was stored in −20 °C, away from light. Two independent purchases of NPB were used in this study.
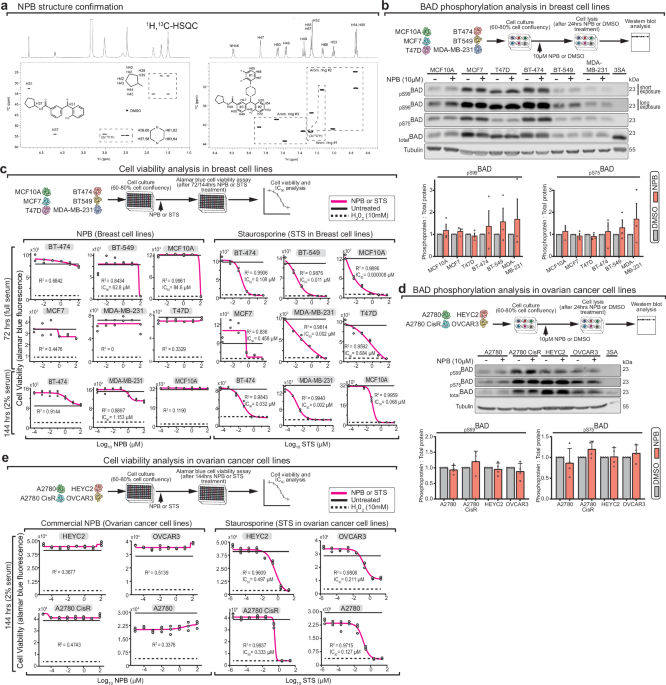
NPB structure validation
NMR spectra were acquired on a Varian INOVA 600 MHz spectrometer: 1D 1H, 2D 1H-1H-COSY, 1H,13 C HSQC and 1D 13 C observed using biopack pulse sequences. Data processing and analysis was performed using VnmrJ v4.2. The mass spectrometry data was acquired on a high-resolution Thermo Orbitrap XL using direct injection.
Cell culture
Six mammary cell lines (MCF10A, MCF7, T47D, BT-474, BT-549 and MDA-MB-231) were purchased in 2021, from ATCC with signed certificates of authentication. Cell lines routinely tested negative for mycoplasma contamination using Mycoplasma Pro PCR detection kit (Applied Biological Materials cat# G239). Similar to the Pandey et al. study2, all breast cancer cell lines were cultured following ATCC recommendations. Specifically, (i) MCF7 in EMEM (ATCC cat# 30-2003) + 0.01 mg/ml human recombinant insulin (Gibco cat# 12585-014) + 10% FBS, (ii) T47D in RPMI-1640 + 0.2 Units/ml insulin (Sigma-Aldrich cat# I-1882) + 10% FBS, (iii) BT-474 in ATCC Hybri-Care Medium (ATCC cat# 46-X) + 10% FBS, (iv) BT-549 in RPMI-1640 (ATCC cat# 30-2001) + 0.023 U/ml insulin (Sigma-Aldrich cat# I-1882) + 10% FBS, and (v) MDA-MB-231 in Leibovitz’s L-15 Medium (ATCC cat# 30-2008) + 10% FBS. Non-transformed mammary cell line MCF10A cells were cultured in DMEM/F12 (Gibco cat# 11330032) supplemented with 5% horse serum, 20 ng/mL EGF (Peprotech cat# AF100-15), 0.5 μg/mL Hydrocortisone (Sigma-Aldrich cat# H-0888), 100 ng/mL Cholera toxin (Sigma-Aldrich cat# C-8052) and 10 μg/mL insulin (Sigma-Aldrich cat# I-1882). Four ovarian cancer cell lines were cultured following Zhang et al.1 protocol: (i) A2780S in RPMI-1640 (Gibco cat# 22400105) + 10% FBS, (ii) A2780CisR in RPMI-1640 + 10% FBS + 1 μM cisplatin (Sigma-Aldrich cat# P4394), (iii) OVCAR3 in RPMI-1640 + 20% FBS + 10 μg/ml insulin (Sigma-Aldrich cat# I-1882) and (iv) HEYC 2 RPMI-1640 + 10% FBS. Both full and 2% FBS concentrations were tested in NPB treatment, and each case is specified in the figure legends.
Western blotting
300,000 cells per well were plated in 6 well plates and monitored until 60–80% cell confluency. Subsequently, fresh culture media with 10 μM NPB or equivalent DMSO volume was added for 24 h before cell scraping in lysis buffer (1% NP 40, 150 mM NaCl, 50 mM Tris-HCL pH 7.6, 5 mM EDTA, 1 mM EGTA, freshly added protease and phosphatase inhibitors). Soluble protein lysates were collected from the supernatant after a 20 min 14,000 × g centrifugation at 4 °C. Lysate concentration was determined by BCA assay and 20 μg of proteins were resolved on SDS-PAGE gels and transferred to nitrocellulose membranes. Primary antibodies used: rabbit-anti-BAD (Sigma-Aldrich cat# B0684), rabbit-anti-BAD-Ser99 (clone D25H8, Cell signaling cat# 4366), rabbit-anti-BAD-Ser75 (Cell signaling cat# 9291) and mouse-anti-Tubulin (clone B-5-1-2, Sigma-Aldrich cat# T5168). Secondary antibodies used: HRP and Alexa Flour 680 coupled anti-Rabbit and anti-mouse antibodies respectively. Blots were scanned using Odyssey LI-COR Fc imager (LI-COR Biosciences) in the chemiluminescence and 700 nm channels. Blot band intensities were quantified with Image Studio™ version 5.2 (LI-COR Biosciences), which applies a local background subtraction determined for each band. All BAD phosphorylation status was normalized to corresponding total BAD.
Alamar blue assay
Cells were plated in opaque 96-well plates with clear bottoms in the following concentrations: A2780S: 6000 cells/well, A2780CisR: 6000 cells/well, HEYC2: 6000 cells/well, OVCAR3: 12000 cells/well, BT-474: 15000 cells/well, BT-549: 2500 cells/well, MCF10A: 5000 cells/well, MCF7: 10000 cells/well, MDA-MB-231: 15000 cells/well and T47D: 15000 cells/well. Next day, cells were treated with NPB 0.0001, 0.001, 0.01, 0.1, 1, 10, 100, and 1000 μM. NPB was serially diluted in DMSO prior to dilution in media at final concentration. Control treatments included staurosporine 0.000005, 0.00005, 0.0005, 0.005, 0.05, 0.5, 5, and 50 μM. All assays included internal controls of cells treated with 10 mM H2O2 to indicate minimum cell viability, and vehicle (2% DMSO for breast cancer cell lines and 1% DMSO for ovarian cancer cell lines) to indicate maximum cell viability. After incubation time, media was discarded and replaced with fresh media with 10% alamar blue (In Vitro Toxicology Assay Kit, Resazurin based, Sigma-Aldrich, #TOX8) in a final volume of 100 μL per well. After 4 h, fluorescence was measured at excitation 560 nm, emission 590 nm in a microplate reader (Synergy, BioTek). Representative graphs are shown. The 4 Parameter Logistic (4PL) regression model was used to fit the cell viability data. R-squared (goodness of fit) was computed to evaluate how well the experimental data could fit the 4PL model equation, with values ≥ 0.95 considered to be a good fit. Viability data plotting, 4PL fitting, R-squared and IC50 computations were done using GraphPad Prism7.
Reporting summary
Further information on research design is available in the Nature Portfolio Reporting Summary linked to this article.