

The Mariners took two of three the last time they were in Sacramento. It was their ninth consecutive series win and moved them to three games up in the AL West. They immediately followed with a long stretch of losing that they’re still recovering from. The Mariners have won more than they’ve lost recently, going 23-16 since bottoming out in Arizona, but their pace has slowed to .500 since the All-Star break. The trade deadline looms, and the Mariners have been described as aggressive — the roster could look different soon. This series will define the task ahead for whoever is on the roster in the season’s final stage.
At a Glance
Mariners
Athletics
Mariners
Athletics
Game 1
Monday, July 28 | 7:05 pm
RHP Luis Castillo
LHP JP Sears
56%
44%
Game 2
Tuesday, July 29 | 7:05 pm
RHP Logan Evans
RHP Luis Severino
47%
53%
Game 3
Wednesday, July 30 | 7:05 pm
RHP Bryan Woo
LHP Jeffrey Springs
56%
44%
*Game odds courtesy of FanGraphs
Team Overview
Overview
Athletics
Mariners
Edge
Overview
Athletics
Mariners
Edge
Batting (wRC+)
103 (7th in AL)
111 (2nd in AL)
Mariners
Fielding (OAA)
-16 (13th)
-22 (14th)
Athletics
Starting Pitching (FIP-)
122 (15th)
101 (8th)
Mariners
Bullpen (FIP-)
105 (14th)
103 (12th)
Mariners
The A’s have been bad this year by just about every measure. They’re bottom five in win rate (.426) and next to last in run differential (-121). They’re trending up this month and enter Monday above .500 in July with a +19 run differential. That includes sweeping the Astros in four games over the weekend, which is both a favor and an omen for the series ahead. While the A’s have a perfectly reasonable 26-31 record on the road, they’ve been absolutely atrocious at home; at 20-31, they have the second worst home record in baseball just ahead of the Rockies. And speaking of Colorado, Baseball Savant has the park factors in Sutter Health Park just a tiny bit behind Coors Field this year.
Athletics Lineup
Player
Position
Bats
PA
K%
BB%
ISO
wRC+
Player
Position
Bats
PA
K%
BB%
ISO
wRC+
Lawrence Butler
CF
L
447
28.6%
9.4%
0.181
98
Nick Kurtz
1B
L
276
31.2%
10.5%
0.374
184
Brent Rooker
DH
R
469
22.4%
10.0%
0.222
130
Shea Langeliers
C
R
310
19.7%
7.7%
0.234
113
Tyler Soderstrom
LF
L
431
23.0%
9.0%
0.197
114
Jacob Wilson
SS
R
396
7.8%
5.3%
0.127
119
Carlos Cortes (AAA)
RF
L
314
14.6%
13.1%
0.281
139
Gio Urshela
3B
R
157
19.1%
7.6%
0.099
70
Luis Urías
2B
R
284
13.4%
9.9%
0.125
88
The A’s lineup has been middling for the season as a whole, but their active roster looks a bit better with a 114 wRC+. Nick Kurtz leads the team in most everything and became the first rookie in MLB history with a four homer game on Friday. Brent Rooker, who was not the Home Run Derby champ, is having another strong season with 21 home runs. Rookie Jacob Wilson started in the All-Star game but has a -24 wRC+ since taking a pitch on the hand on July 8. Lawrence Butler is also in a bit of a slump, going 3-for-38 since the break.
Probable Pitchers
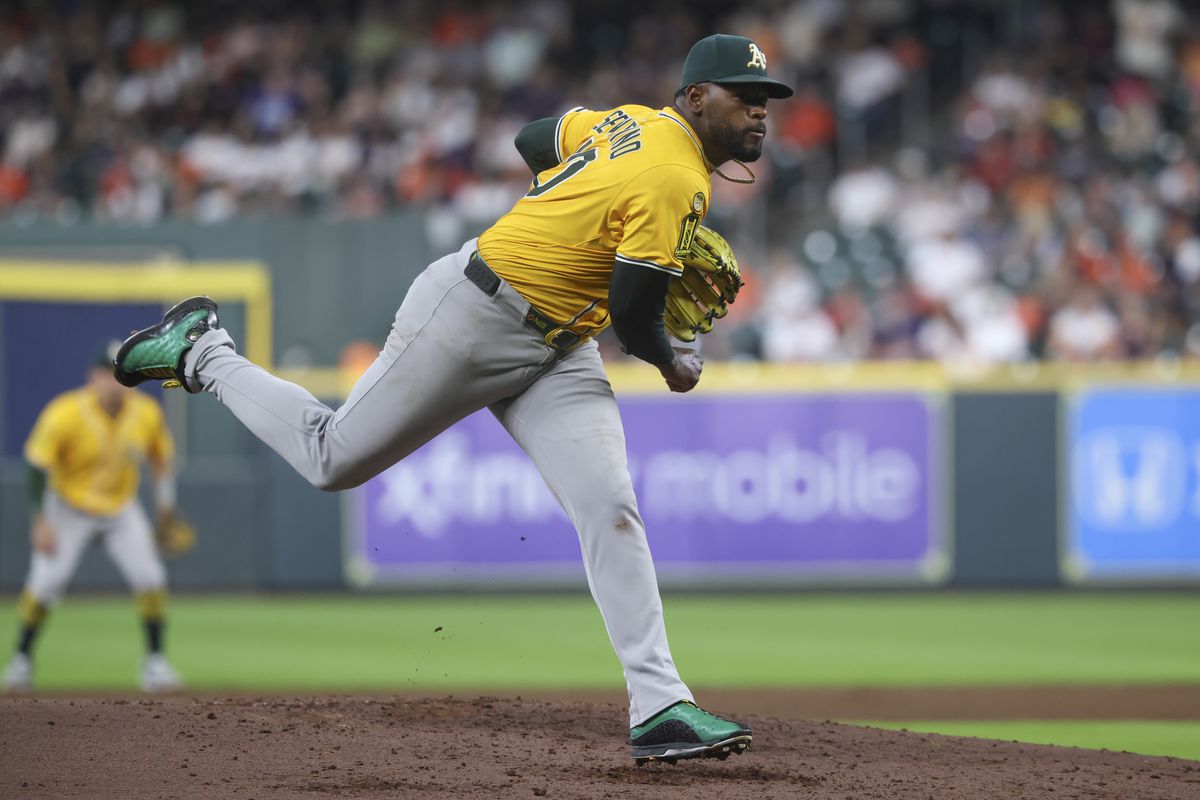
Troy Taormina-Imagn Images
Game 1 Pitching Matchup
Pitcher
IP
K%
BB%
HR/FB%
GB%
ERA
FIP
Pitcher
IP
K%
BB%
HR/FB%
GB%
ERA
FIP
JP Sears
106.2
20.1%
5.8%
12.7%
28.3%
4.98
4.94
Luis Castillo
120
21.3%
7.2%
8.5%
41.8%
3.30
3.60
LHP JP Sears
Pitch
Frequency
Velocity
Stuff+
Whiff+
BIP+
xwOBA
Pitch
Frequency
Velocity
Stuff+
Whiff+
BIP+
xwOBA
Four-seam
39.0%
92.2
79
87
85
0.374
Sinker
5.7%
90.3
73
71
78
0.418
Changeup
15.7%
83.2
76
71
93
0.308
Slider
12.3%
80.2
122
71
81
0.288
Sweeper
27.4%
79.1
122
76
94
0.223
From a previous series preview:
JP Sears is a familiar foe, having been drafted and developed by the Mariners and spending the last three years as the A’s de facto ace. His extreme fly ball tendencies were lessened a touch last year after he added a sinker to his pitch mix, but he still allowed 28 home runs to fly over the fence. Despite the continued dinger problem, he actually lowered his ERA a bit while still outpacing his FIP and xFIP by pretty wide margins.
Game 2 Pitching Matchup
Pitcher
IP
K%
BB%
HR/FB%
GB%
ERA
FIP
Pitcher
IP
K%
BB%
HR/FB%
GB%
ERA
FIP
Luis Severino
125.1
16.7%
7.3%
9.2%
40.8%
4.95
4.21
Logan Evans
59.1
16.8%
8.2%
12.7%
41.0%
3.64
4.82
RHP Luis Severino
Pitch
Frequency
Velocity
Stuff+
Whiff+
BIP+
xwOBA
Pitch
Frequency
Velocity
Stuff+
Whiff+
BIP+
xwOBA
Four-seam
26.5%
96.0
105
91
88
0.366
Sinker
22.1%
95.7
96
70
128
0.323
Cutter
17.5%
93.1
96
72
117
0.377
Changeup
5.2%
86.5
92
56
85
0.459
Slider
4.4%
87.0
131
41
94
0.209
Sweeper
24.3%
84.8
131
63
87
0.304
From a previous series preview:
The A’s handed out the largest free agent contract in their franchise history to Luis Severino this offseason. There are worse ways to spend money in baseball, but Severino definitely isn’t the ace he once was with the Yankees. He did complete a pretty successful comeback campaign last year with the Mets, completing a full season for the first time since 2018 with some solid results. He added a sinker to his pitch mix last year and it really helped him keep the ball on the ground more often to go along with the swing-and-miss stuff already present in his arsenal. He’s got name recognition and isn’t that far removed from being a frontline starter. That’s a valuable thing for the pitching starved A’s.
Game 3 Pitching Matchup
Pitcher
IP
K%
BB%
HR/FB%
GB%
ERA
FIP
Pitcher
IP
K%
BB%
HR/FB%
GB%
ERA
FIP
Jeffrey Springs
120
18.9%
7.8%
12.0%
32.2%
4.13
4.70
Bryan Woo
126.2
24.3%
4.8%
10.7%
39.1%
2.91
3.46
LHP Jeffrey Springs
Pitch
Frequency
Velocity
Stuff+
Whiff+
BIP+
xwOBA
Pitch
Frequency
Velocity
Stuff+
Whiff+
BIP+
xwOBA
Four-seam
41.9%
90.5
89
68
80
0.344
Cutter
4.6%
86.8
88
77
126
0.456
Changeup
26.3%
79.4
101
127
90
0.276
Slider
23.1%
83.5
95
61
88
0.385
Sweeper
4.1%
76.1
95
From a previous series preview:
Jeffrey Springs was the other big offseason acquisition for the A’s after they brought him over in a big trade with the Rays. Springs enjoyed a breakout season in 2022 but was injured early in the next season and needed Tommy John surgery, costing him the rest of 2023 and most of 2024. His stuff was pretty diminished in his seven big league starts last year, but his surface level stats looked pretty good. When he’s at his peak, his changeup is a pretty deadly weapon and he emerged from his injury rehab with a new cutter under his belt. He’ll need to find some extra velocity on his fastball to hit his ceiling — he lost more than a tick off his heater last year — but his secondary offerings are all top notch.
The Big Picture:
AL West Standings
Team
W-L
W%
Games Behind
Recent Form
Team
W-L
W%
Games Behind
Recent Form
Astros
60-46
0.566
—
W-L-L-L-L
Mariners
56-50
0.528
4.0
L-W-L-W-L
Rangers
56-50
0.528
4.0
W-W-W-W-W
Angels
51-55
0.481
9.0
L-L-W-L-W
Athletics
46-62
0.426
15.0
L-W-W-W-W
AL Wild Card Standings
Team
W-L
W%
Games Behind
Recent Form
Team
W-L
W%
Games Behind
Recent Form
Yankees
57-48
0.543
+1.5
W-L-L-L-W
Red Sox
57-50
0.533
+0.5
L-W-L-W-W
Mariners
56-50
0.528
—
L-W-L-W-L
Rangers
56-50
0.528
—
W-W-W-W-W
Rays
53-53
0.500
3.5
W-L-L-L-L
Following their sweep of the A’s over the weekend, the Rangers have moved into a tie with the Mariners in the standings. Texas visits Anaheim this week before the absolutely massive four-game series in Seattle this weekend. As mentioned above, the Astros were swept at home in a four-game series against the A’s and will look to bounce back against the Nationals this week. In the Wild Card race, the Yankees are facing a pretty major crisis after Aaron Judge was placed on the IL with an elbow injury over the weekend. They’ll host the quickly receding Rays for four games this week. Meanwhile, the Red Sox beat the Dodgers last weekend and head to Minnesota for a quick road trip this week.