
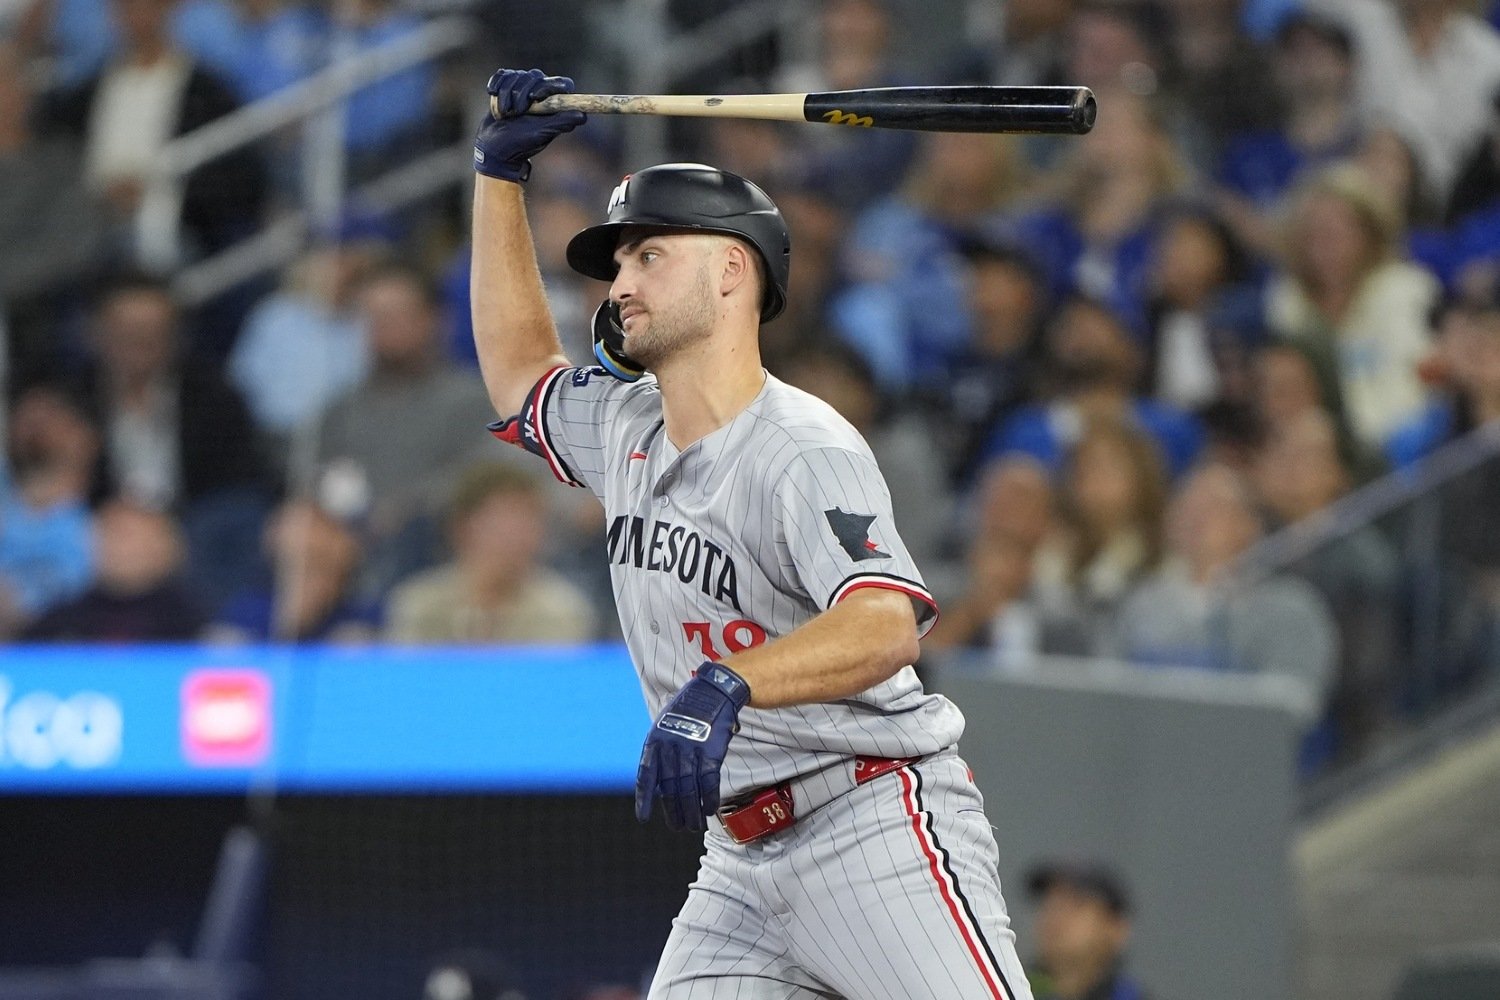
Editor’s Note: Welcome to the final installment of a series meant to dig deeper into the most compelling enigma on the 2025 Twins: outfielder Matt Wallner. Check out Eric Blonigen’s piece about Wallner and Trevor Larnach, and Cody Pirkl’s on whether Wallner deserves more respect than he gets from either fans or his employers. Today, though, we’ll take the conversation down a slightly different path.
This article started with an email. Almost two weeks ago, I got a note from Twins Daily co-founder John Bonnes. It came in the wake of the Twins’ win over the Tigers on August 17—a good game, but one in which Matt Wallner went 0-3, with nothing but a walk after the game had long been decided. Specifically, in the bottom of the third, Wallner had come up with runners on the corners and one out, and he’d struck out. It got John thinking.
“I was reminded that his WPA this year is negative,” John wrote. “And, in fact, he’s never had a positive WPA greater than 0.5. Which, I think is a big discrepancy from his WAR.”
He was alluding to win probability added, of course. That stat apportions credit and blame to hitters and pitchers for the outcomes of games, using the expected runs and wins implied by the situations in which each plate appearance takes place and the effect of the outcome of each such battle on those expectations. Different sites measure these things very slightly differently, and I’ll use Baseball Reference’s framework for this piece; they did credit Wallner with 0.6 WPA in 2024. John was right, though, to note that Wallner is at -0.6 this year. Despite an OPS+ of 122 that suggests stoutly above-average production, he hasn’t pushed the Twins toward wins this year. On balance, he’s pushed them away from them.
Naturally, John was also right that that lack of value from a context-sensitive perspective stands in stark contrast with the inputs for his WAR value at Baseball Reference, and elsewhere. The best way to view this, perhaps, is to compare his batting runs (Rbat, the number of runs the site’s model estimates he’s been worth relative to a league-average batter) with his RE24 (the runs he’s added based on the expected runs when he came up, after accounting for the 24 possible base-out states). This doesn’t account for fluctuations in game leverage, but it adjusts from measuring raw outcomes to baking in the runners on base and the number of outs each time Wallner came to bat. His Rbat this year is 10. His RE24 is just 2.4.
When you hear that, surely, you think the same thing everyone else does: well, sure. That extreme high-strikeout, power-over-hit profile leads to homers and walks and pretty individual numbers, but it can’t win games.
“So I just looked at Joey Gallo’s stats page and found something very similar,” John continued. “Gallo had a few years where his WAR was four. Overall, for his career, his WPA was negative. Even in those years that he posted a high WAR, WPA was barely positive.”
It’s true. Gallo had -4.2 WPA for his career, though he rated as an above-average hitter before adjusting for situations. Gallo, like Wallner, had a patient approach and light-tower power, but ran a strikeout rate near the upper limit of what the league will accept. Thus, John posed the question:
“Is it possible this type of player Fs with the correlation that we have between WAR and winning games? Like, if you are a player whose OPS is heavily dependent on SLG, does WPA tend to have a negative discrepancy compared to WAR? In short, are the cranks on all-or-nothing hitters right?”
It’s a fair question. In fact, if we want to properly value one of the presumptive core pieces of the team’s medium-term future, it’s one we’d better find a good answer to. So I decided to try.
Offense is made up, mostly, of four components: the ability to avoid strikeouts, the ability to draw walks, the ability to get hits on balls in play, and the ability to hit for power. Strikeout rate, walk rate, BABIP and isolated power (ISO, which is just slugging average minus batting average) are the big four for a first-level analysis of any player. Here’s what I did:
Assembled a list of all players with at least 100 plate appearances this year (n=471)
Listed their rOBA, Baseball Reference’s context-neutral rate stat for offensive output; strikeout and walk rates; BABIP and ISO; and WPA/PA, which is just their win probability added divided by their number of plate appearances, to make WPA a rate stat, too.
Found the correlations between (first) rOBA and (next) WPA/PA for BABIP, ISO, K% and BB%
If we’re onto something here—if how you generate value at the plate influences how much you contribute situationally—we should see a different relationship between those correlations for rOBA than for WPA/PA. Here’s the data.
Correlation to:
BABIP
ISO
K%
BB%
rOBA
0.59
0.72
-0.18
0.38
WPA/PA
0.42
0.58
-0.18
0.29
Ratio
1.4
1.26
0.98
1.29
The correlations are (almost) all considerably stronger for rOBA than for WPA/PA, which makes sense. Adding things beyond the control of the hitter (the situation in which he comes to bat) adds noise to the whole system. Still, as you can see, there’s something to the idea that different shapes of production matter more (or less) when you add the game state to the equation. There’s evidence, here, that striking out more makes you less helpful to winning games than your simple stat line implies. On the other hand, power still appears to be pretty important. It’s the ability to find holes when putting the ball in play (a noisy skill to begin with, as we know) that loses the most potency when we switch from a context-neutral to a context-dependent way of measuring batting value.
The “or-nothing” in all-or-nothing hitters seems to be the broad source of their problems producing as many wins as the runs they produce would be expected to create. But that’s a bit of a problem for our narrative. Wallner is hitting for more power and walking just as much this year, but he’s striking out markedly less than he did in 2024. It’s still a lot, but he’s less extreme than he used to be. The category in which he’s suffered in 2025, as our previous examinations of him this week have already shown, is BABIP, which isn’t supposed to be what makes or breaks a hitter’s capacity to influence WPA as much as they increase raw scoring.
In Wallner’s case, at least, the answer’s simpler and less structural than that. Guys who depend on slug don’t broadly tend to have a worse WPA than you’d expect; that’s only true of certain individuals. Once we acknowledge that, we can look a bit closer.
Here are Wallner’s 2025 (and career) numbers in low-leverage, medium-leverage, and high-leverage situations.
Low Leverage: .289/.359/.726 (.284/.380/.631)
Medium Leverage: .150/.267/.260 (.195/.315/.371)
High Leverage: .125/.327/.350 (.205/.339/.425)
In the plate appearances that hardly matter at all, in terms of winning or losing, Wallner is a machine. When the stakes rise even modestly, though, he’s pretty bad—and specifically, he becomes extremely dependent not on hitting for power, but on drawing walks to deliver any value. So, is Wallner simply un-clutch?
That can, of course, be part of the answer. For that matter, that can be extrapolated a bit to other hitters, too. Even if leaning on power and striking out a lot don’t fundamentally lead to less win production than run production on their own, do they make one less likely to be able to hit the better pitchers who tend to pitch more important innings?
For that, perhaps, there’s some evidence. If you’ve been trying to figure out why the Twins themselves also seem not to have much faith in Wallner, by the way, this is the time to start paying extra attention. What’s one trait we can safely say most high-leverage pitchers have, to set them apart from those who work when the game is essentially decided? They throw harder. Here’s the run value (per 100 pitches) for all Twins hitters on pitches at a velocity of at least 96 mph, among those who have seen at least 100 such pitches this year.
Willi Castro: 0.048
Brooks Lee: -0.497
Harrison Bader: -0.855
Byron Buxton: -0.934
Carlos Correa: -1.128
Kody Clemens: -1.680
Wallner: -1.682
Royce Lewis: -1.762
Ryan Jeffers: -1.826
Trevor Larnach: -1.900
Ty France: -1.909
Christian Vázquez: -2.472
That might not look so bad—no one on the Twins has hit heaters that hot all that well this year, and Wallner falls in the middle of the pack. Maybe it’s simply too hard to hit upper-90s fastballs to expect anyone to regularly hit them hard. Alas, all this really turns out to mean is that the Twins are uniquely bad at handling those fastballs. Among 138 players who have seen at least 200 such heaters this year, almost half (65) have positive run value against them, and Wallner’s rate ranks 120th of the cohort.
Why, though? The defining characteristic of Wallner at the plate is his elite bat speed. We could understand France or Larnach or even Jeffers getting overwhelmed a bit by pitches approaching triple digits on the radar gun, but why Wallner? That’s the next question, and one we probably can’t completely or perfectly answer here. This is a durable problem, though, and one tied to the nature of his swing. Over a decade ago, before Statcast gave us any insights like these, I began to suppose that what great bat speed really does for hitters is allow extra time for the swing decision—facilitating power by letting a hitter spot the spin on a breaking pitch or the telltale change in arm action on a changeup, and still (after starting late) get the barrel out in front of them and hammer the ball.
Meanwhile, the hitters who handle velocity well might or might not have great bat speed, but what gets them to those high-octane heaters on time and on plane is the fact that they make early decisions. Wallner makes slightly late ones, and as good as bat speed is, the difference between someone who triggers their swing early and someone who can’t is larger than that between someone with 76 mph bat speed and someone at 72. The problem with a very simple plan to start sooner, for someone with that 76-mph swing like Wallner (or Gallo), is that they might end up too early on breaking or offspeed stuff.
Wallner is limited by his inability to hit good fastballs. He can do plenty of other things, but not being able to do that puts a low ceiling on his real, situational utility. That’s why he bats lower in batting orders than you might otherwise guess, and it’s why his raw numbers don’t match his win probability metrics. When the game is on the line, teams know how to create a bad matchup for him. If he can eventually fix this—if some approach adjustment allows him to get started earlier, without ending up ahead of everything but the game’s best fastballs—Wallner might well blossom into a truly lethal slugger. For now, though, the curmudgeons are at least partially right about him—even if not for the exact reasons John and I might have initially imagined.