
There are two things that bother me about doing stats during the baseball season. The first is the overemphasis on small sample sizes. Some of you may have read my Hall of Fame index pieces before. Those analyze 15 and 20 year careers. We are condensing the 2025 season to one month of baseball.
The second problem is that all statistics are a snapshot in time. I have to pick a date and go with those numbers. Obviously, within a few days those numbers will be skewed one way or another. I chose to get as close to the one-sixth mark as possible, so I picked stats going into the Detroit Tiger series. We’ve already seen an eight run outpur in the opener, so who knows what this will look like by the time you are reading it.
That being said, when you are through 26 games you begin to see some settling in as far as numbers go. So, what we are looking at is purely the statcast batting average and slugging percentage along with an estimated statcast OBP given the exact same walk rate. We will also look at the strikeout and walk rates going into that series.
For some of these positions, there really is only one option. However, with most positions there are a couple of different options. As we get closer to the one third pole on the season, we are getting closer to getting some clarity on how those at bats should be distributed. So, as follows you will see the statcast slash lines with OPS in the fourth slot. Then, we will look at strikeout rate and walk rate.
Catcher
Yainer Diaz: .215/.244/.422/.666, 18.6 K%, 3.5 BB%
Victor Caratini: .251/.333/.380/.713, 21.6 K%, 8.1 BB%
I should point out that Caratini is pretty close to the big league averages across the board. He is also probably the better defensive catcher of the two. I genuinely want to give Diaz every opportunity to break out of this funk and judging by the statcast numbers, he is due SOME positive regression, but as we get closer to Memorial Day it might be time for a more equitable division of labor.
First Base
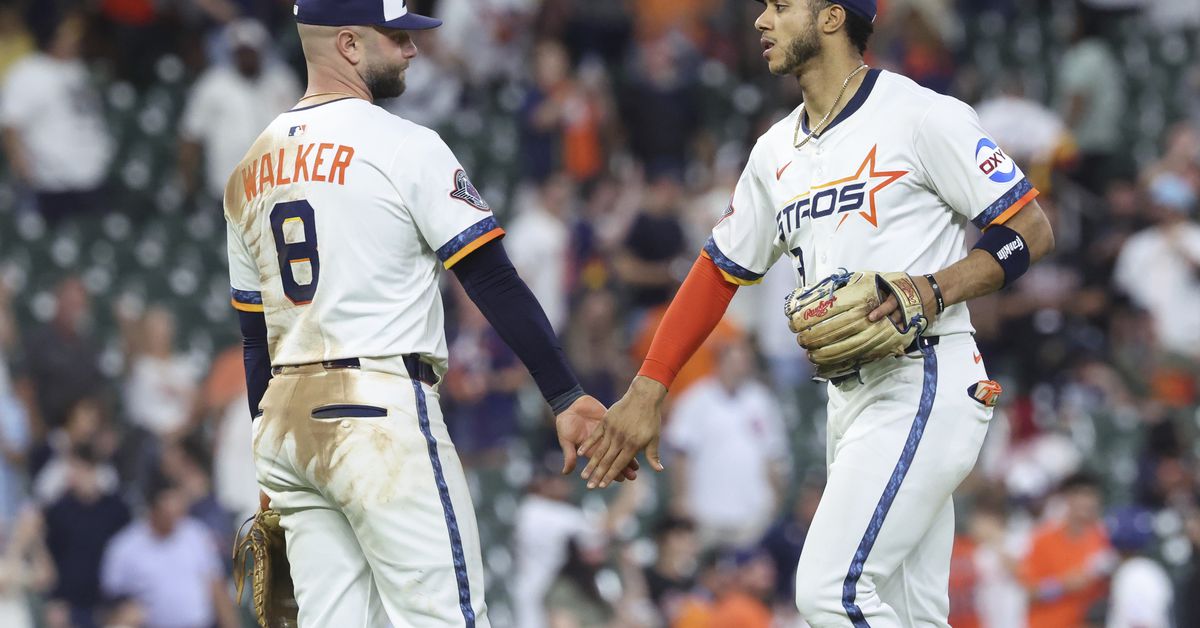
Christian Walker: .211/.296/.352/.648, 32.1 K%, 7.5 BB%
Walker already has four dingers on the season, so he is really not all that far removed from what was advertised. We expected a guy with a relatively low average, but healthy walk rate, and strong home run rate. He has given us close to that. Morever, the last time we checked he actually had the highest percentage of picked throws out of the dirt of any first baseman. This guy is not Jose Abreu.
Second Base
Brendan Rodgers: .226/.318/..357/.675, 33.3 K%, 10.5 BB%
Mauricio Dubon: .269/.332/.330/.662, 7.7 K%, 7.7 BB%
This has the makings of an old-fasioned hot/cold platoon. You simply ride the wave. Rodgers has an actual OPS around .600 while Dubon’s is closer to .520. Based on the statcast numbers they both should be better. Here is hoping for some positive regression and maybe both can see better numbers if Espada successfully manages their exposure.
Third Base
Isaac Paredes: .250/.347/.357/.704, 17.9 K%, 11.1 BB%
Paredes has been solid defensively and he is the kind of hitter I love. He takes walks and even when he is not taking walks he is seeing a ton of pitches. His lack of bat speed will probably never allow him to be a middle of the order masher, but the short porch in Daikan is already showing dividends.
Shortstop
Jeremy Pena: .300/.372/.458/.830, 14.5 K%, 8.1 BB%
The key for Pena is finding some way to replicate that walk rate. Yes, it is only league average, but league average is a huge step up for him. The statcast numbers are one of the biggest candidates for positive regression and he is already off to a solid start. Altuve wants him to get an extension and right now it looks like a good bet.
Left Field
Jose Altuve: .223/.259/.356/.615, 20.4 K%, 5.3 BB%
Yordan Alvarez: .263/.362/.524/.886, 17.4 K%, 13.8 BB%
Altuve hit a dinger in the opener of the Tiger series, so hopefully these numbers will be slightly different. He is the one negative regression candidate on the roster. Obviously, he can also play second, so this lineup can shift around a lot. Yordan is the single biggest positive regression candidate on the team. That shouldn’t be a surprise.
Center Field
jake Meyers: .247/.291/.336/.627, 25.0 K%, 6.3 BB%
Chas McCormick: .267/.372/.336/.708, 24.1 K%, 13.8 BB%
I’d say the numbers above pretty much represent who McCormick is minus his 2023 career year and his 2024 slump. All in all, the Meyers numbers are probably also accurate. He swipes some bags, makes some plays in the outfield, and hits the occasional home run, but this team wins more ballgames if McCormick gets a bulk of the playing time.
Right Field
Cam Smith: .251/.345/.379/.724, 28.9 K%, 9.2 BB%
Zach Dezenzo: .262/.303/.392/.695, 37.1 K%, 5.7 BB%
The choice between the two is what is often called a straw man in philosophical circles. It is a false choice. You can play both at the same time and the team is probably better off if you do. You could play Altuve at second and stick both Smith and Dezenzo in the outfield. Obviously, you can also play Meyers and Chas at the same time as well. The Dezenzo numbers look unsustainable, but we are also talking small sample sizes and part-time play. Both players probably start making more contact with more regular playing time.
Overall Observations
We were seeing higher walk rates in the beginning, but most guys are settling into career norms. Still, guys like Paredes, Walker, and Rodgers have a history of walking more often. Unfortunately, including all of them in the lineup at the same time would also bring more strikeouts. It’s the yin and yang of that style of baseball. At any rate, it looks like the team in general is due for positive regression and that by itself is good news for a team already playing above .500 (as of this writing).