
Heading into last year’s trade deadline, I wrote an article about the areas in which I thought the Brewers needed to upgrade. One of the things I pointed out was that at the time, Milwaukee ranked near the bottom of MLB for OPS and Defensive Runs Saved from shortstop. I went on to write that based on this figure, Joey Ortiz’s defensive abilities had slipped, a statement which was met with quite a bit of pushback from commenters. One reader pointed out that -7 DRS didn’t match the eye test, and others generally agreed that the figure didn’t seem to be an accurate representation.
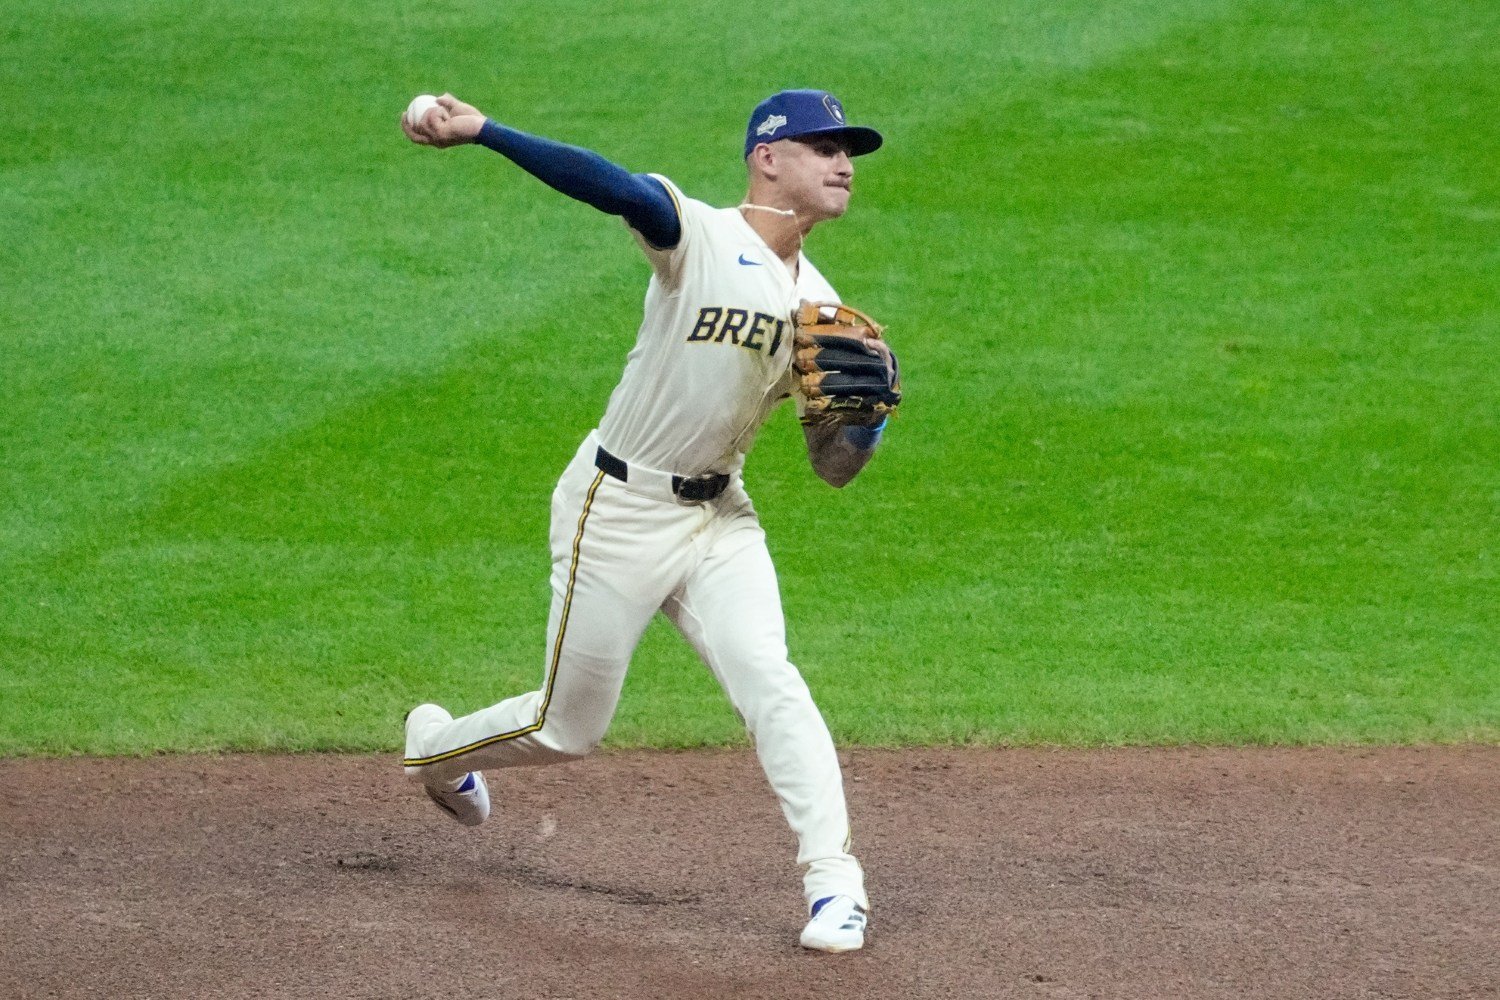
In an effort to save what little journalistic reputation I currently have, I tried my best to explain what was going on, but to be honest, I was starting to get as confused as everyone else. His numbers at the end of the season only made things worse. After playing 1,217 ⅔ innings at shortstop in 2025, Ortiz ended with 12 Outs Above Average (5th among shortstops) and -2 Defensive Runs Saved (14th among qualified shortstops). So how is it that these numbers, which should theoretically give us a quick idea of whether someone is a good, great, or bad defender, are telling two different stories?
Interestingly enough, he wasn’t even the only Brewer for whom this was true. I wrote another article about Brice Turang’s diverging defensive narratives in August. So, since I wasn’t the only one who was confused by exactly what these numbers meant and how to interpret them, I figured a deeper dive into each was necessary.
Defensive Runs Saved (DRS)
In the beginning, the main way to assess a player’s defensive abilities was fielding percentage. It was a simple formula (putouts divided by total chances), but it was far too basic to capture any of the nuance of fielding. A great example is Nick Castellanos, who had a perfect 1.000 fielding percentage in 2022, 2023, and 2025 as a starting outfielder, but is also a notoriously bad defender.
The DRS framework was first introduced in 2009 by John Dewan and Bill James, who had used data from Sports Info Solutions dating back to 2003 to consider more variables in the field. In their modern forms, these are:
ART (Airballs, Range, and Throwing) Runs Saved (All Fielders)
Good Plays/Defensive Misplays and Errors Runs Saved (All Fielders)
Bunt Runs Saved (Corner Infielders, Catchers, Pitchers)
Double Play Runs Saved (Middle Infielders and Corner Infielders)
Outfielder Arm Runs Saved (Outfielders)
Pitcher Stolen Base Runs Saved (Pitchers)
Catcher Stolen Base Runs Saved (Catchers)
Strike Zone Runs Saved (Catchers)
Catcher Adjusted Earned Runs Saved (Catchers)
To calculate all of this, each component of a play is assigned a bucket and a difficulty value. The bucket depends on which aspect of defense is being tested. For example, a right fielder throwing out a runner going first to third would receive credit to this rARM, while a smooth double play by two middle infielders would go into their rGDP buckets.
This value is based on the percentage of similar balls in play that were successfully converted to outs. So, if the throw from the right fielder to third base was made into an out in 99% of similar situations (unlikely, but go with me), it would get an expected value of 0.99, while a tough diving stop to start a double play that was made by 1% of shortstops would have a value of 0.01. If the play is successfully made, the player receives (1 – expected value) to the respective bucket. If they botch it, they lose that much value. So a successful routine grounder with an expected success rate of 85% would net a fielder 0.15 plays above average, but flubbing it would leave them with a -0.85.
The value of each bucket then gets converted to a run total, based on context and a run expectancy matrix. The final DRS for a given player is the difference between the total value of their plays made and missed in all buckets relevant to their positions and the league average.
Most are pretty straightforward, but I wanted to highlight two that sound pretty darn similar: rGFP and rPM. rPM stands for Runs from Plus-Minus, which primarily tracks range and assigns a value to each batted ball based on characteristics like location and historical success rates. rGFP is used in special circumstances where a defensive action contributes or costs value based on playmaking or intellect, rather than sheer ball-chasing. Examples include a first baseman scooping a bad throw or a batter being held to a single instead of a double because of an outfielder’s actions. This also counts against the player for doing things like missing the cutoff man or messing up a double play to get one out instead of two.
The numbers are broken down by category on the Fielding Bible website, so (for instance) we can see that Ortiz was much better moving to his left than to his right; got value from his strong arm but struggled on turning double plays; and came out essentially even in defensive misplays and good plays, though that doesn’t mean that he made the same number of them. He just had a roughly average ratio between them for a shortstop.
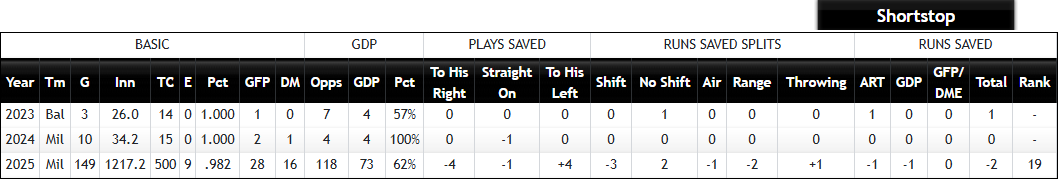
We don’t get to see which plays moved the needle the most, though, so a negative DRS may mean that they’re average but regularly struggle with more difficult plays, or it could mean they’re messing up routine plays. Like WAR, DRS attempts to factor in every detailed aspect of fielding a baseball and arrive at a somewhat definitive number, but we tend to get summary judgments from it, rather than play-by-play breakdowns.
For more information, feel free to check Fielding Bible’s FAQ on DRS.
Outs Above Average (OAA)
Outs Above Average was one of Statcast’s ways of gauging a player’s defense. It came out shortly after the system was introduced league-wide in 2015. Like DRS, it’s calculated slightly differently depending on which position you’re assessing.
In the outfield, each ball in play is assigned a catch probability value based on the distance an outfielder has to cover, the direction he must travel, and the time he has to get to his destination. Like DRS, the fielder receives credit for each play made equal to (1 – catch probability) and loses value equivalent to the catch probability for failing to make the play.
The infield is similar, but uses a more complex formula to handle the additional defensive intricacies. It considers distance covered and time, but it also accounts for the distance from the fielder at the “intercept point” (position after getting to the ball) to the base the runner is heading for. On force plays, it also factors in the sprint speed of the hitter.
The biggest difference between OAA and DRS is that the former almost solely measures range, while the latter uses range as one of several ingredients in the recipe. This allows OAA to be calculated without video review, as the calculation is purely number-based. Furthermore, OAA is context-neutral, as it’s purely outs, not runs. This means a play made with the bases empty and one with the bases loaded counts the same.
This partially explains why some players have such a disparity between their OAA and DRS figures. One good example is Bobby Witt Jr., who had 24 OAA and just 3 DRS in 2025, a disparity of 21. He and Zach Neto were the only two players I found to have a disparity this significant between the two metrics last season. Witt had a fairly high number of Defensive Misplays and Errors (33, which was eight more than Ortiz), but rated very well with his arm and was great going to his right, which made up for some weaknesses on balls up the middle. That pattern (good arm, better right than left, a few more mistakes than would be ideal) maps neatly to DRS; OAA just viewed him as making more plays above average than DRS’s system estimated.
Given what we now know about DRS and OAA, we could state that a play that would negatively impact DRS more than OAA could look something like:
A mistake made in a higher run expectancy situation (e.g., runners in scoring position)
A fair hit that was fielded in a way that allowed a runner to advance further than he should’ve
A double play that resulted in just one out
Based on this criteria, one example could be this play against the Athletics, where a soft flip to second baseman Jonathan India recorded an out but a better throw could’ve allowed the Royals to pick up an additional out.
This play may fall into the higher run expectancy situation category, because a late spinning throw by Witt results in a run scored (and a game lost).
Ah, but one other issue is that OAA and DRS are not calculated on the same scale. You can hear it in their names, right? One is runs saved; the other is outs added, or hits saved. For instance, Witt’s 3 DRS came on 6 Plays Saved; there’s a remaining conversion to be made. Each play made saves part of a hit, and thereby saves a fraction of a run. The OAA model’s cousin makes that conversion from outs added to runs saved, to put Statcast and Sports Info Solutions’s metrics on the same footing.
Fielding Run Value (FRV)
FRV is Statcast’s answer to DRS. It’s largely based on OAA, which is why most players who have high OAA figures will also have high FRV figures, even if they score poorly in DRS. It also bakes in throwing; framing and blocking for catchers; and other subtle skills. FRV converts underlying metrics into runs, but it shouldn’t tell you a story that’s different from OAA.
Because many fans don’t understand that it’s the final form of OAA (and because of its hellaciously awkward name), FRV is cited less often than either of the other two. Whereas OAA is easy to find (it shows up on every player’s Savant summary), and whereas DRS is the original advanced defensive metric, it’s hard to immediately grasp the utility of FRV. Nonetheless, to properly compare two players, look either at their PART Plays Saved (on the Fielding Bible site) and their OAA, or at their DRS and their FRV.
Offensive metrics have always been far easier to assess than defensive ones. Even with a head start, though, there’s disagreement over which metrics truly describe how good a hitter is. Things have now been refined enough where for many, using OPS or wRC+ is usually sufficient to get your point across, but things are not so simple for defensive numbers.
OPS+ and wRC+ never diverge significantly, but that’s because they more or less measure the same thing and are made up of very similar inputs. On the other hand, DRS and OAA/FRV do some things materially differently.
Subjectively, DRS makes the most sense to me as a solid measure of cumulative defensive production. That doesn’t mean that OAA and FRV are wrong; they just make some different assumptions and incorporate human help to a lesser degree. There’s only so much we can unpack without getting access to more granular data on individual plays, but at the very least, we can now translate numbers to meaning. Choose your fighter according to your new, improved understanding about these numbers and what forms them.