Image credit:
(Photo by Rich Graessle/Icon Sportswire via Getty Images)
As has become custom, now that two weeks have passed since the 2026 Hall of Fame election results were announced, the Baseball Writers Association of America (BBWAA) has publicly announced the results of the 350 voters out of 425 total who agreed to make their votes public.
With the public results now fully available, there are some notable trends from recent Hall of Fame voting worth examining.
Are Modern Voters Too Picky?
Nostalgia is a powerful drug. It can make one think wistfully about the good old days, which often were never as good as they appear in memories.
When it comes to the Hall of Fame, there’s a running thought among some baseball fans that the Hall of Fame standards have become too lax. Pitchers who can’t even sniff 200 wins are now being considered when 300 wins used to be the badge needed for admission.
In actuality, there’s a very strong case to be made that the current electors are much too picky. Nowadays, voters don’t view nearly as many players as HOF-worthy as voters previously did. Going back to 1936, BBWAA members who have been active for 10 or more years are eligible to vote for the Hall of Fame.
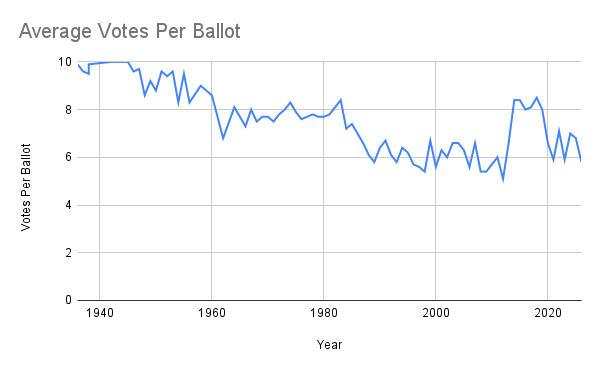
In 2026, the average BBWAA voter voted for 5.8 players. That’s dramatically lower than the number of players the average BBWAA voter voted for throughout most of the 82 different BBWAA Hall of Fame elections.
When the BBWAA first began voting for the Hall of Fame, voters were instructed to select 10 players from the ballot (although not every voter selected the full 10). It wasn’t until the 1950s that wording on the ballot was changed to say that voters could select up to 10 players.
But even after that change, voters generally voted for eight or more candidates on average.
That number has steadily declined since then, even as the number of eligible players has risen dramatically. When voters were making selections in the 1940s, 1950s and even the 1960s, they were voting only for American and National League players who had played in an era where there were 16 eligible teams.
Even with more platooning and larger rosters, there were 146 MLB hitters who had 500 or more plate appearances in 2025. In 1955, there were 76 hitters who reached 500 plate appearances. Even with vastly heavier starting pitching workloads, there were only 55 pitchers who threw 150-plus innings in 1955. In 2025, there were 70. There were 150 pitchers in 1955 who threw 50-plus innings. Last year, there were 339.
While the population of eligible players has effectively doubled, the number of players being picked by the average voter has dropped 17% from the 1960s to the 2020s and 31% from the 1950s to now:
DecadeAverage Votes1930s9.71940s9.51950s9.11960s7.71970s7.81980s7.21990s6.12000s6.02010s7.32020s6.4
The average of 5.8 players selected by each voter in 2026 is the lowest number since 2012 when the all-time low of 5.1 players picked was set:
Older Voters Generally Vote For Fewer Players
So, how do different BBWAA voters vote? I wanted to look at how different eras of current voters make their choices.
To compile this, I looked up the first year of BBWAA membership for all active BBWAA members who are voters. Anyone not on the active badge list was classified as inactive. BBWAA members who were already eligible are allowed to vote for the Hall of Fame for 10 years after they last were an active BBWAA member.
This is not a perfect proxy by age, obviously. One person may get a BBWAA card as a 23-year-old. Others, like me, may not get a BBWAA card until many years later. But some generalizations can be made.
It’s fair to say that anyone who first received a BBWAA badge as a working member of the baseball media in the 1990s or before has been around quite a while, while someone who received their BBWAA badge in the 2010s and has just recently become an eligible voter is generally likely to have had a shorter career so far in baseball media.
As a wide-ranging approach, it is a pretty clear indicator of how long voters have been covering baseball and a useful measure of newer voters vs. long-time voters.
The study found that BBWAA Hall of Fame voters who have been card members for longer vote, on average, for significantly fewer players than those who have not been voting as long.
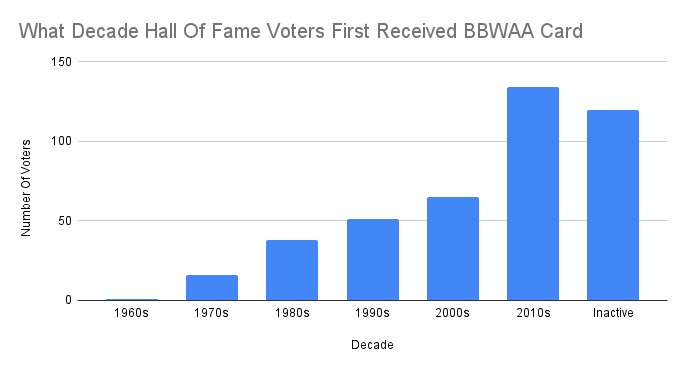
Here is the breakdown on the average number of candidates voted for by voters from each decade (as determined by when they first received a BBWAA card):
DECADEAVG players
VOTED FORNUMBER
OF VOTERS1970s4.291980s5.5331990s5.0442000s6.3512010s7.0115Inactive5.598Non-Public Voters4.675TOTAL5.8425
Of the 19 voters who voted for zero or one candidate, eight are not active members and eight of the other 11 first received a BBWAA card before 2000.
Of the seven voters who made their ballots public who did not vote for anyone, all seven were either inactive BBWAA members (two) or voters who first received their BBWAA card before 2000.
On the other end of the spectrum, of the 76 public voters who voted for the maximum number of 10 candidates, 39 are from the 2010s and 11 are from the 2000s:
DECADEVoted FOR MAX
Player TotalPERCENTAGE1970s00%1980s515.15%1990s36.82%2000s1121.57%2010s3933.91%Inactive1818.37%
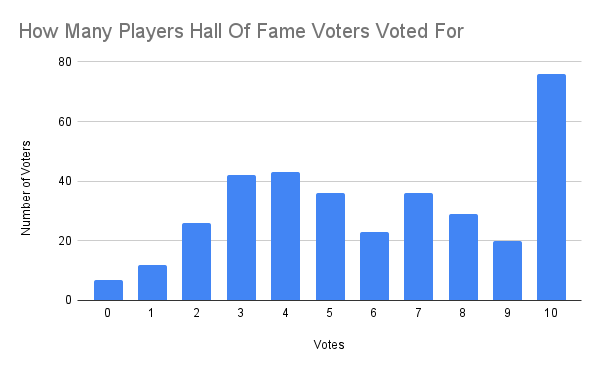
Here is the breakdown of how many players each public voter selected. The overwhelming most popular choice among public voters was to vote for the maximum allowed number of 10. The second most popular choice was to vote for four players (43 voters) or three (42 voters):
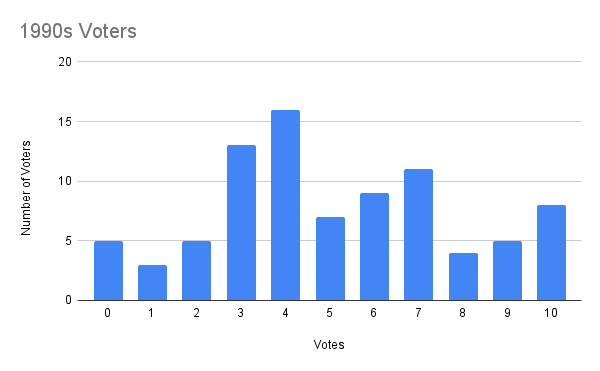
There’s a clear difference between the voting patterns of voters who first received their BBWAA badges before 2000:
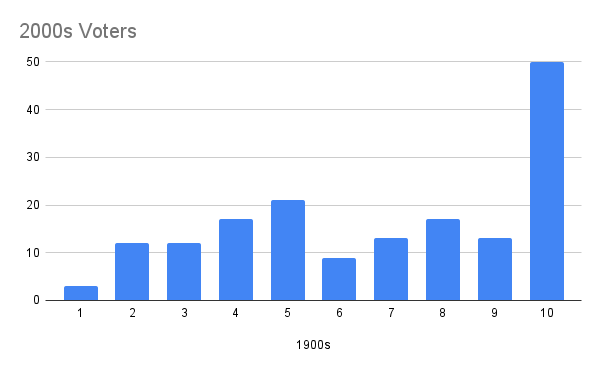
And voters who first received a BBWAA badge in the 2000s:
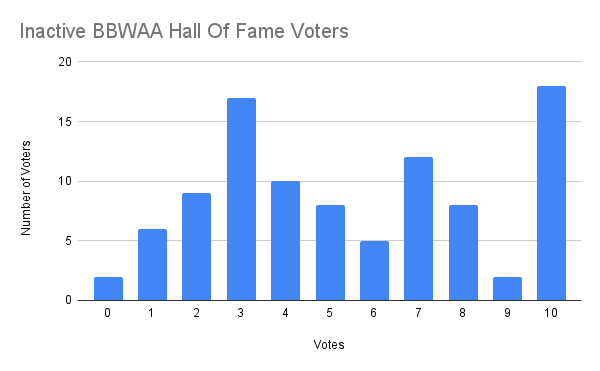
The voters who are no longer active BBWAA members split the difference between the two, showing some of the tendencies for fewer votes that echoed the older voters as well as a similar spike at 10 to the younger voters:
As noted before, even the 7.0 average players picked by 2010s voters is well below what was the norm up until the 1980s.
Private Ballots Voted For Fewer Players
The 75 voters who did not opt to make their ballots public voted, in general, for fewer candidates. Overall, voters averaged 5.77 votes per ballot. Among public voters, that number rose to 5.98. Among voters who kept their votes secret, it was only 4.77 votes per ballot. That 4.77 average is lower than every decade tracked other than voters from the 1970s.
In addition to that, there are some clear trends among the voters who decided not to make their votes public. Of the voters who first received a BBWAA badge in the 1960s or 1970s, nearly 50% (8 of 17) did not make their votes public. Among voters who no longer have an active BBWAA badge, 19% chose to keep their ballots secret.
While the 1980s, 1990s and 2010s all had a similar number of secret voters, the 2000s had a proportionally higher number of voters who did not make their ballots public:
DecadeNumber
OF VOTERSNON-PUBLIC
VOTERSPERCENTAGE1960s11100.00%1970s16743.75%1980s38513.16%1990s51713.73%2000s651421.54%2010s1341813.43%Inactive1202319.17%Total4257517.65%
The MLB.com Voter Spike Was Significant
This year saw the largest increase in the number of voters in years, spurred by the BBWAA decision in 2016 to admit MLB.com writers. Of the 54 first-time eligible voters, 26 were MLB.com writers.
The 54 voters from the 2016 BBWAA badge class is the largest group of voters by far. No other BBWAA class has more than 20 voters. Voters who have become eligible to vote for the Hall of Fame in the past six years (with first BBWAA badges from 2010-2016) made up 31.5% of the electorate. It’s likely that active BBWAA members who first received their badges from 2000 onwards will become a majority of the electorate in the next couple of years.
The Hall of Fame’s rule changes (also from 2016) to provide Hall of Fame voting eligibility for BBWAA voters for only a decade after they shift to inactive status also is altering the electorate:
Public Voting Is Much More Common
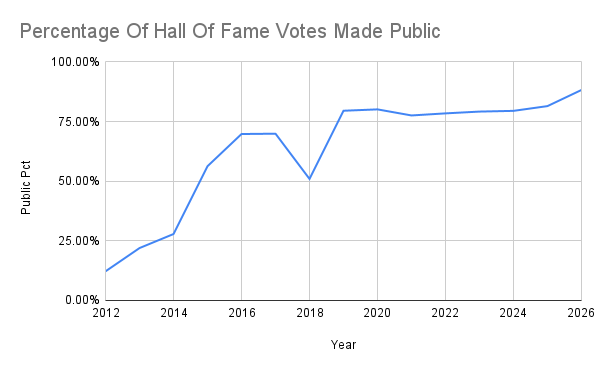
In 2012, the BBWAA began publicly identifying the ballots of voters who opted to have theirs revealed. Since then, the BBWAA has requested that the Hall of Fame make all votes public, but the Hall of Fame has declined to do so.
Back when the practice began, it was a very small sliver of the electors who chose to reveal their votes. Now, it’s the voters who keep their votes private who are the rare exceptions.
In that first year when votes could be made public, only 12.2% of the voters did so. This year, a record 88.2% of votes are public. The rules that put a time limit on inactive BBWAA voters has likely played a role in this, as well: