
The Mariners found a way to squander the goodwill of their strong start to a punishing 10-day roadtrip by finishing with a clunker in Houston, barely scraping one win out of four games and seeing their advantage in the AL West suddenly shrink like a rogue Kardashian threw a waist trainer on it. They return to T-Mobile Park for a long, three-team homestand, starting with the Washington Nationals, who are towards the bottom of their division but coming off a strong stretch of play where they’ve gone 7-3 over their last 10 games.
At a Glance
Nationals
Mariners
Nationals
Mariners
Game 1
Tuesday, May 27 | 6:40 pm
LHP Mitchell Parker
RHP Logan Evans
44%
56%
Game 2
Wednesday, May 28 | 6:40 pm
RHP Trevor Williams
RHP George Kirby
33%
67%
Game 3
Thursday, May 29 | 6:40 pm
LHP MacKenzie Gore
RHP Emerson Hancock
51%
49%
*Game odds courtesy of FanGraphs
Team Overview
Overview
Nationals
Mariners
Edge
Overview
Nationals
Mariners
Edge
Batting (wRC+)
96 (10th in NL)
114 (2nd in AL)
Mariners
Fielding (OAA)
-15 (15th)
-11 (14th)
Mariners
Starting Pitching (FIP-)
97 (7th)
92 (6th)
Mariners
Bullpen (FIP-)
112 (14th)
105 (10th)
Mariners
The Nationals, coming into this series at five games below .500, aren’t playing great baseball, but they’re certainly showing more competency than the Marlins and are nipping at the heels of longtime bully division Atlanta. They’re coming in at 7-3 largely driven by a sweep of the Orioles, who the Mariners will also see this homestand, and a series win against Atlanta, but were recently swept by the Cardinals and are coming in off a series loss to San Francisco.
As a team still building towards their next contention cycle, the Nats are about where one might expect. Their biggest off-season move was acquiring former Ranger don’t-call-me-Nate Nathaniel Lowe for reliever Robert García; so far the Rangers seem to be winning that trade, as Lowe is off to a rough start with Washington despite sharing the same first three letters of their respective names. The central source of excitement for Nationals fans during this rebuilding cycle is in waiting for their farm system to bear fruit, especially the players brought in via trades as the Nationals have dealt off usable pieces to other teams during this fallow period.
Nationals Lineup
Player
Position
Bats
PA
K%
BB%
ISO
wRC+
Player
Position
Bats
PA
K%
BB%
ISO
wRC+
CJ Abrams
SS
L
177
18.6%
6.2%
0.238
145
James Wood
LF
L
233
26.2%
12.9%
0.259
155
Nathaniel Lowe
1B
L
222
27.5%
8.6%
0.164
90
Keibert Ruiz
C
S
186
10.2%
4.3%
0.086
94
Luis García Jr.
2B
L
178
14.0%
6.2%
0.131
77
Josh Bell
DH
S
170
23.5%
10.6%
0.140
56
Robert Hassell III
CF
L
175
19.4%
6.9%
0.117
99
José Tena
3B
L
106
21.7%
7.5%
0.103
82
Daylen Lile
RF
L
176
13.1%
6.8%
0.172
150
Hassell and Lile’s stats from minor leagues.
The current Nationals lineup is made up of several of those players brought in through trades, most notably the Juan Soto trade, which netted Washington leadoff man CJ Abrams, along with outfielders James Wood and Robert Hassell III, and pitcher Mackenzie Gore, who technically doesn’t belong in the lineup section but will make an appearance during this series. Abrams is off to a scintillating start this season, already poised to surpass his WAR from 2024, although those numbers might be somewhat illusory; Statcast still has a lot of blue sliders on his batted-ball data, as witnessed in his sky-high BABIP. There’s nothing illusory on James Wood’s Statcast profile, which glows sci-fi red thanks to elite bat speed and ability to barrel up the ball; he strikes out a hair more than you’d like, but you live with it for the power potential and the fun of watching “what if you put a baseball bat in Stretch Armstrong’s arms?”.
Outside of those two, the rest of the lineup chugs along; longtime Kate favorite contact merchant Robert Hassell III has been recalled, although not because he was particularly tearing things up at Triple-A Rochester, and Keibert Ruiz, acquired from the Dodgers in the Max Scherzer trade, is also…fine. The lone homegrown prospect with significant MLB time on this roster, Luis García Jr., has been disappointing after a potential breakout season last year; he continues to never strike out, but a bottom-percentile Chase% seems to have caught up with him this season. Daylen Lile is the other homegrown prospect in the projected lineup, coming in with a monster minor-league resume; the Nationals called him up a week ago to replace injured outfielder Jacob Young.
Probable Pitchers
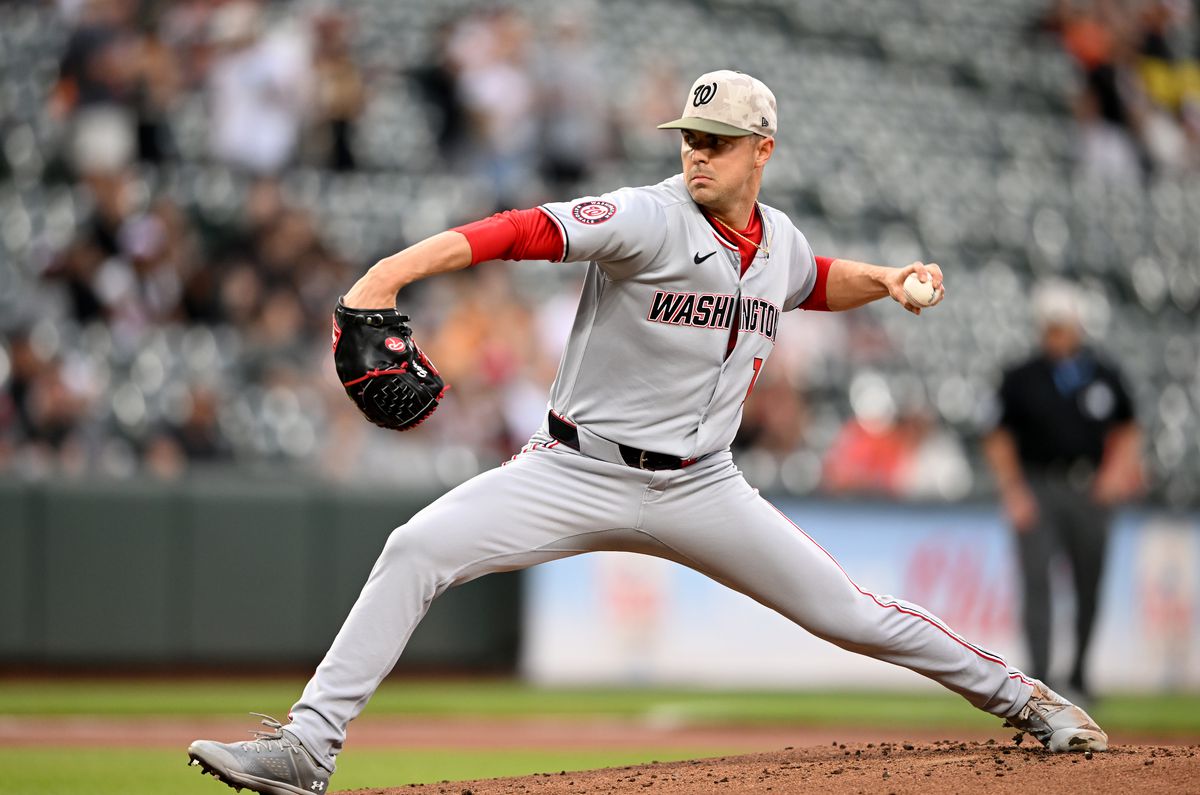
Photo by Greg Fiume/Getty Images
Game 1 Pitching Matchup
Pitcher
IP
K%
BB%
HR/FB%
GB%
ERA
FIP
Pitcher
IP
K%
BB%
HR/FB%
GB%
ERA
FIP
Mitchell Parker
55 1/3
15.1%
10.5%
2.8%
43.0%
4.39
3.76
Logan Evans
27
17.9%
7.7%
16.1%
37.2%
3.33
4.93
LHP Mitchell Parker
Pitch
Frequency
Velocity
Stuff+
Whiff+
BIP+
xwOBA
Pitch
Frequency
Velocity
Stuff+
Whiff+
BIP+
xwOBA
Four-seam
53.3%
92.7
86
51
131
0.373
Splitter
19.2%
84.9
100
85
96
0.249
Curveball
17.2%
81.4
99
85
69
0.287
Slider
10.3%
85.2
96
120
76
0.232
Mitchell Parker had a surprisingly good rookie season last year. He never really stood out as a prospect thanks to below average command and a repertoire that relies on deception more than raw stuff. His 6.7% walk rate last year was the best it’s ever been at any professional level and it shouldn’t be a surprise to see that it’s jumped nearly four points this year. Despite his strikeout and walk rates backsliding, he’s somehow managed to lower his FIP a few points. He’s enjoyed some pretty good BABIP luck and a miniscule home run rate — both of which aren’t supported by his sub-par batted ball metrics.
Game 2 Pitching Matchup
Pitcher
IP
K%
BB%
HR/FB%
GB%
ERA
FIP
Pitcher
IP
K%
BB%
HR/FB%
GB%
ERA
FIP
Trevor Williams
49 1/3
18.3%
6.7%
12.1%
39.1%
6.39
4.29
George Kirby (2024)
191
23.0%
3.0%
9.6%
41.3%
3.53
3.26
RHP Trevor Williams
Pitch
Frequency
Velocity
Stuff+
Whiff+
BIP+
xwOBA
Pitch
Frequency
Velocity
Stuff+
Whiff+
BIP+
xwOBA
Four-seam
36.8%
87.4
94
57
113
0.359
Sinker
9.9%
86.6
83
Changeup
13.7%
81.3
86
163
121
0.335
Slider
9.8%
80.4
101
Sweeper
29.9%
76.8
101
98
95
0.203
After years of generally average production as a swingman, Trevor Williams enjoyed a short-lived, late-career breakout last year. He added a sweeper to his pitch mix and significantly improved his strikeout-to-walk ratio. Unfortunately, an elbow injury cut his season short in late May and he only returned to make two starts in September. He re-signed with the Nats on a two-year deal but has struggled to reproduce the same level of success this year. His sweeper has continued to be a solid pitch but opposing batters are learning to just sit on his fastball before he can turn to his breaking ball.
Game 3 Pitching Matchup
Pitcher
IP
K%
BB%
HR/FB%
GB%
ERA
FIP
Pitcher
IP
K%
BB%
HR/FB%
GB%
ERA
FIP
MacKenzie Gore
62 1/3
36.2%
8.2%
14.3%
34.3%
3.47
2.82
Emerson Hancock
39 1/3
15.7%
6.7%
18.2%
44.9%
5.95
5.36
LHP MacKenzie Gore
Pitch
Frequency
Velocity
Stuff+
Whiff+
BIP+
xwOBA
Pitch
Frequency
Velocity
Stuff+
Whiff+
BIP+
xwOBA
Four-seam
48.9%
95.4
105
95
86
0.410
Cutter
5.6%
90.2
105
Changeup
9.1%
86.0
96
155
92
0.327
Curveball
23.5%
81.8
95
158
84
0.243
Slider
12.9%
86.4
97
147
81
0.150
It took a while, but MacKenzie Gore finally looks like the frontline ace the Nationals hoped they were getting when they acquired him in the big Juan Soto trade a few years ago. His stuff has never really been in question — a hard fastball and a plethora of secondary options give him a deep repertoire to work with. His success has always hinged on his ability to command his stuff and he seems to have figured out that wrinkle this year. It helps that all four of his secondary pitches are running whiff rates north of 45%.
The Big Picture:
AL West Standings
Team
W-L
W%
Games Behind
Recent Form
Team
W-L
W%
Games Behind
Recent Form
Mariners
29-23
0.558
—
W-L-W-L-L
Astros
28-25
0.528
1.5
L-W-L-W-W
Rangers
26-29
0.473
4.5
L-L-L-W-L
Angels
25-28
0.472
4.5
W-W-L-L-L
Athletics
23-31
0.426
7.0
L-L-L-L-W
As mentioned in the intro, the Mariners’ cushion in the AL West made a whoopie cushion farrrrrrrrt noise as they got bullied by the Astros in Houston. The biggest news in the standings is probably the sharp divergence of the two California teams: on one hand, the Angels, Undertaker-memeing themselves awake with a best-in-division 7-3 run, while the pesky Athletics have fallen on hard times lately, winning just one of their last 10 games, although they were victim to the Angels’ surprising run over a four-game sweep (a reverse Mickey Mop, if you will) and then had to battle the very good Phillies. They’ll now face the Astros in Houston for a short two-game set so goooo [Redacted] Athletics, we love the [Redacted] Athletics.