
Good morning, and thanks for spending part of your day with Extra Points.
Quick announcement before we get going today. We’re thrilled to announce yet another school has signed up for Extra Points Library, Lamar:

Now Lamar athletic administrators can access our library of contracts, athletic department budgets, bylaws and other important documents, at a fraction of the price of current competitors.
We are so close to being ready to share a completely new version of Extra Points Library with the world, one that is faster, deeper, and way better at sharing insights from all our collected data. To learn more about potentially using EPL for your athletic department, classroom, newsroom or organization, drop me a line at [email protected]
I know it’s almost March Madness, and we’ll get to men’s and women’s basketball shortly. Today, I’d like to share the information we’ve put together for college baseball.
First, some notes on the methodology
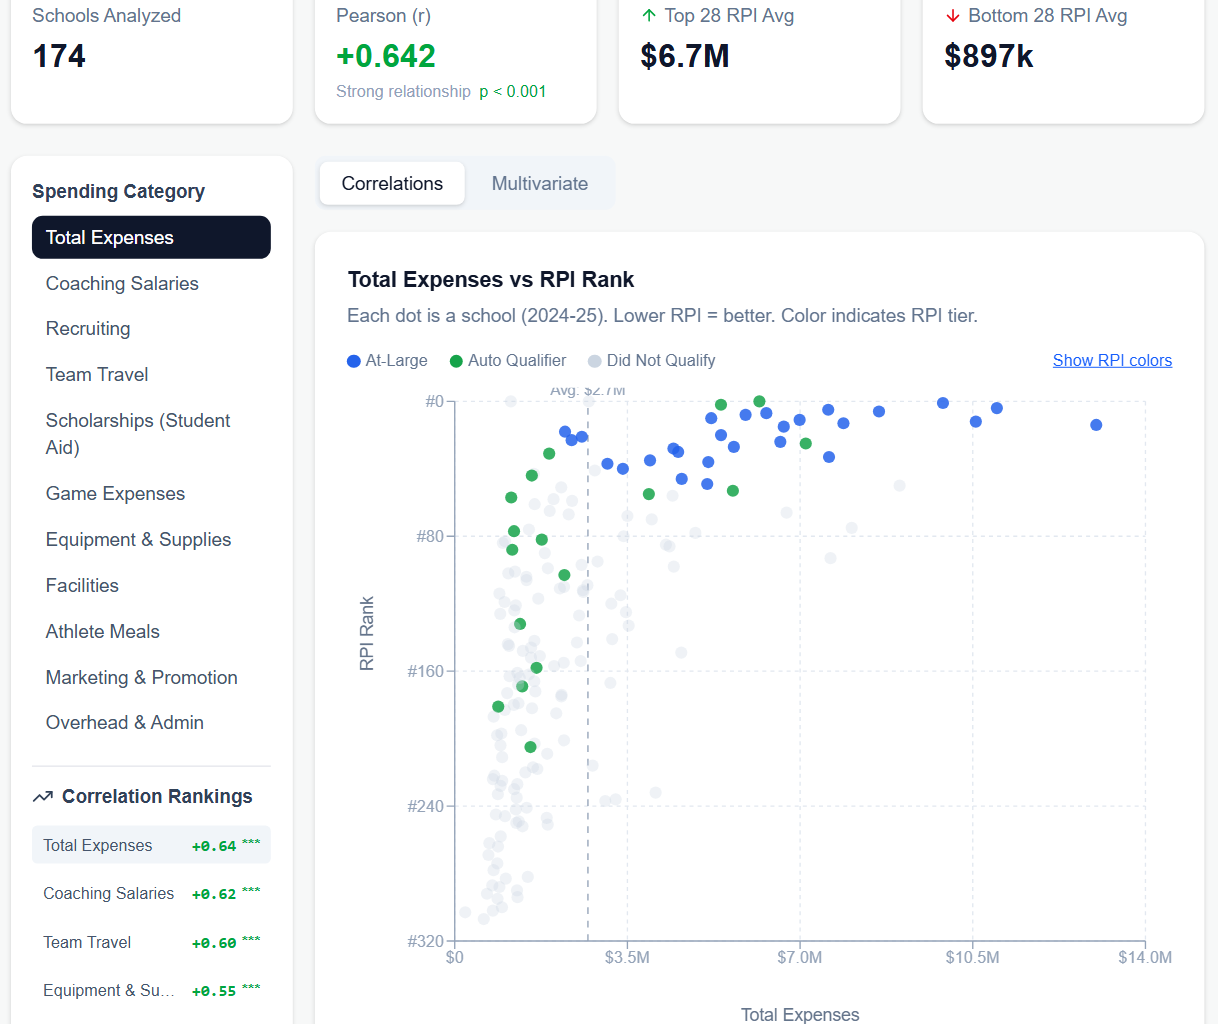
Every D-1 and D-II school files an itemized athletic department budget report with the NCAA, called the MFRS report. This report breaks down how athletic departments generate and spend money, itemized by sport. It’s not a perfect data set, but it’s the closest thing we have in college sports to a unified data set.
We obtain these documents by filling hundreds of Open Records Requests. Because of those requests, and because of our data analysis, we’re able to compare spending across more than 170 schools.
The data you’ll see referenced here, and in all future newsletters in this series, comes from the Total Operational Expenses line item from that report. That number includes all the money a school spends on coaching salaries, administrative salaries, scholarships, travel, software, recruiting, and all sorts of other operational expenses. It does not include athlete revenue share payments. The numbers we are talking about here are not the “salary cap” for each team.
This data also comes from FY25, or July 1 2024-June 30 2025. That would be the 2025 college baseball season, when LSU won the national title, beating Coastal Carolina.
And finally, we can only obtain data from schools that respond to open records requests. Private schools, like Stanford, Duke, Yale, etc do not have to respond to FOIAs, and thus do not publish their MFRS reports. A few public schools, like Pitt, Temple, UCF, Delaware and Delaware State, are exempt from state open records laws. A handful of other schools have not yet responded to our repeated requests, either because they limit FOIAs to in-state residents (so we have to pay a stand-in), or because they’re simply very slow at responding to requests.
We are currently missing data from Air Force, Alabama State, Alabama A&M, Alcorn State, Army, Coppin State, ETSU, Georgia Tech, Florida, FIU, Jackson State, Morehead State, Morgan State, North Alabama, Texas Southern, Troy, South Alabama, South Carolina Upstate, UNC-Asheville, UNC-Greensboro, UC-Santa Barbara, UL-Monroe, UMBC, UT-Chattanooga, Tennessee State, and UT-Martin. If you happen to have the FY25 MFRS report for any of these schools, I’ll happily give you free premium Extra Points in exchange (and/or give you any of ours).
Here are the Top 25 Operating Budgets from FY25.
The complete table, mean, median and #analysis will drop after the jump:
University of Tennessee, Knoxville
Louisiana State University
University of Mississippi
University of Arkansas, Fayetteville
Texas A&M University, College Station
University of Texas at Austin
University of South Carolina, Columbia
Mississippi State University
University of North Carolina, Chapel Hill
University of Nebraska-Lincoln
Coastal Carolina University
University of California, Los Angeles