
It’s important to examine league-wide and team-level data and trends before digging into player analysis for fantasy baseball. That’s partly because of the recent rule changes, specifically regarding stolen bases and automated balls and strikes. Pitch velocity, stuff, exit velocity and bat speed have been the focus of most in the fantasy baseball space because it tends to lead toward positive outcomes.
[Draft your Yahoo Fantasy Baseball team for the 2026 MLB Season]
We’ll start with a few surface-level advanced stats across the league before examining team-level stolen base, starting pitcher and velocity band information to help inform us for 2026 fantasy baseball leagues.
Advertisement
Batting Average
From 2021 to 2025, the league-wide batting average has been under .250. It goes both ways, but there’s value in having hitters with higher batting averages. Meanwhile, it may not be as devastating to have a hitter with a batting average around .240. Unsurprisingly, when batting average rises and falls, batting average on balls in play (BABIP) does too. We’ve seen the league-wide zone contact rate increase to 86% in 2025, with the overall contact rate at 76.9%. That’s the highest zone contact rate since 2016 and the best contact rate since 2018.
Exit Velocities and More
Generally speaking, hitters had the highest hard-hit percentage at 41% in 2025, in the Statcast era. For context, they’ve been tracking hard-hit percentage (percent of batted balls 95 mph or higher) since 2015. Unsurprisingly, hitters boasted the highest barrel per plate appearance rate (5.9%) in 2025 throughout the Statcast era, with it being at 5.3% (2024) and 5.5% (2023) over the previous two seasons.
Advertisement
Launch angles have been gradually rising to 13-14% over the past handful of seasons. And speaking of launch angles, we’ve seen the highest average exit velocity on flyballs and line drives (93.3 mph), hard-hit percentage (50.2%) and barrel rate (17%) in 2025 throughout the Statcast era. Theoretically, home runs should be more plentiful throughout fantasy baseball drafts, especially in the later rounds when the batting average risk increases.

Power hitter leaders sorted by EV on FB/LD. (Photo by Corbin Young/Yahoo Sports)
The visual above shows the hitters sorted by average exit velocity on flyballs and line drives (EV on FB/LD), including launch angle, Exit Velocity 50 (EV50), sweet spot percentage and barrel per plate appearance rate. Baseball Savant defines EV50 as the hardest 50% of a hitter’s batted ball events. Potential sleeper hitters from a power standpoint include Jo Adell, Byron Buxton, Colson Montgomery, Matt Chapman, Seiya Suzuki, Matt Wallner, George Springer, Jac Caglianone, Roman Anthony and Wilyer Abreu.
Stolen Bases and Attempts
There have been more stolen bases in recent seasons with the new stolen base rules, as we discussed in a previous article. In 2023, 20 teams stole 100 or more bases. The number of teams with 100 stolen bases dropped to 18 in 2024 and bounced back to 22 teams in 2025. Five teams never reached 100 stolen bases from 2023 to 2025, including the White Sox, Rockies, Tigers, Giants and Blue Jays. It might be related to the players on the team with stolen base juice or the manager’s philosophy, though there’s likely a mix of both.
Advertisement
On the flip side, 14 teams stole 100 or more bases in three consecutive seasons. That list includes the Diamondbacks, Red Sox, Cubs, Reds, Guardians, Royals, Brewers, Mets, Phillies, Pirates, Padres, Mariners, Rays and Nationals. There’s a good chance these teams will run at a high rate again in 2026, giving us some confidence in players who showed stolen-base upside in their profiles. Opportunity matters, so let’s look at the teams with 100 or more stolen base attempts in 2025 compared to 2024, as seen below:

Teams with 100 or more stolen base attempts in 2025 vs. 2024. (Photo by Corbin Young/Yahoo Sports)
Unfortunately, the Angels, Giants and Rangers lacked the stolen base output in 2025, so they might be the outliers on that list. On the flip side, four teams saw their stolen base opportunities decline by 95 or more in 2025 compared to 2024. That list includes the Diamondbacks, Athletics, Mets, and Yankees. Thankfully, all four teams stole 100 or more bases, with the Athletics seeming like a 2025 outlier to watch, as seen below:

Teams with 100 fewer stolen base attempts in 2025 vs. 2024. (Photo by Corbin Young/Yahoo Sports)
The more actionable list might be the teams that ran often and stole plenty of bases throughout the past few seasons, especially if they have a consistent manager. According to ATC projections, 21 hitters are projected for 20 home runs and 20 steals. The notable hitters going outside the top 50 in average draft position (ADP) include Luis Robert Jr., Oneil Cruz, Randy Arozarena and Trevor Story.
Advertisement
Hitters that don’t project for 20/20 but could push for it in 2026 include Brice Turang, Trea Turner, Dylan Crews and Jarren Duran.
Stolen bases can be found more easily during drafts and on the waiver wire, but that means the floor and ceiling have been elevated, so don’t ignore the category.
Starting Pitcher Stuff
The league-wide starting pitcher ERA was at 4.21 in 2025 and 4.15 in 2024. It’s been somewhat of a roller coaster ride for league-wide ERA since it dropped from 4.45 in 2023, with a low season in 2022 (4.05), yet mostly above 4.34 from 2019 to 2021. While velocity has gradually increased throughout the league-wide data, starting pitchers’ swinging-strike rate consistently hovered around 10.6% to 11% from 2019 to 2025.
Advertisement
Meanwhile, starting pitchers’ Stuff+ (98-99) and Location+ (101) have remained consistent from 2020 to 2025, when the Stuff models were on FanGraphs. That aligns with the overall swinging-strike rates being relatively stable throughout recent seasons. Interestingly, seven teams saw an increase in their Stuff+ by 1.5 points or more in 2025 compared to 2024. That includes the Athletics, Guardians, Rockies (say what?!), Tigers, Marlins, Mets and Rangers, as seen below.

Teams with 1.5 points increase in Stuff+ in 2025 vs. 2024. (Photo by Corbin Young/Yahoo Sports)
We have six teams that lost 1.5 or more points in Stuff+ in 2025 compared to 2024, including the Braves, Orioles, Royals, Angels, Mariners, Blue Jays and Nationals. The Mariners might be the most surprising team since they typically had above-average grades in Stuff+ while locating and commanding their pitches well. Besides the Mariners, Braves and Orioles flashed a Stuff+ above 100 in 2024, potentially suggesting their starting pitchers’ stuff declined in 2025. Or there’s a chance those numbers regress in favor of their starting pitchers in 2026 based on health and pitch-level adjustments.

Teams with 1.5 point loss in Stuff+ in 2025 vs. 2024. (Photo by Corbin Young/Yahoo Sports)
Starting Pitcher Innings Per Game Started
Nine teams averaged five or fewer innings per game started in 2025, including the Athletics, Tigers, Marlins, Brewers, Twins, Mets, Rockies, Dodgers and White Sox. The Brewers, Mets, Tigers and Dodgers have better team contexts than the others, which might suggest their starting rotations lack depth. Usually, we see the Rays toward the bottom, but they tied for seventh with 5.3 innings per game started.

Teams with 5 or fewer IP per games start in 2025. (Photo by Corbin Young/Yahoo Sports)
Meanwhile, in 2024, eight teams averaged five or fewer innings per start, including the Guardians, Rays, Dodgers, Brewers, Giants, Marlins, White Sox and Tigers. The Tigers, Brewers, Dodgers, Marlins and White Sox show up again, suggesting this might be a trend to monitor beyond their SP1 or SP2 in their real-life rotation. The Athletics, Tigers, Dodgers, Marlins, Rays, Rockies and Giants were repeats in 2023, among the 11 teams logging five or fewer innings per game started. The five other teams were the Pirates, Red Sox, Royals and Reds.
Advertisement
It hints at being cautious with investing in Dodgers’ starting pitchers beyond Yoshinobu Yamamoto, though Emmet Sheehan deserves breakout appeal. Shohei Ohtani, Roki Sasaki, Tyler Glasnow and Blake Snell will have their innings limited. Maybe there’s value in looking for middle-relief options like Justin Wrobleski and Ben Casparius.
On the flip side, the league average for innings per game started was 5.2 in 2025, so here’s a look at the 14 teams averaging 5.3 innings per game started. That list includes the Diamondbacks, Braves, Red Sox, Cubs, Reds, Guardians, Astros, Royals, Yankees, Phillies, Mariners, Cardinals, Rays and Rangers. When we filter by the past two seasons, the starting pitchers for the Braves, Cubs, Astros, Royals, Yankees, Phillies, Mariners and Cardinals have been going deeper into games than the average pitcher.
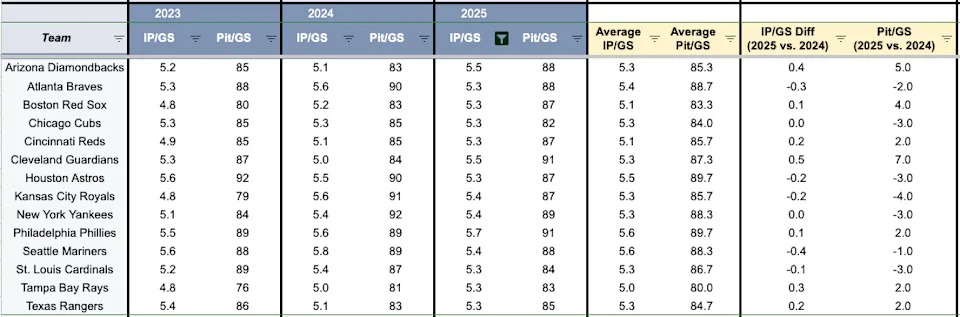
Teams with 5.3 IP per games start in 2025. (Photo by Corbin Young/Yahoo Sports)
Targeting most of the Mariners’ starting pitchers makes sense based on their track record and skill, though there were recent injury issues for Bryan Woo, George Kirby, Logan Gilbert and Bryce Miller. The Cubs have boring veterans like Jameson Taillon and Matthew Boyd, who still possess above-average skills, though they might fare better in leagues with quality starts part of their scoring settings.
Advertisement
This doesn’t mean we should fade or target these teams that averaged more or fewer innings or pitches per game started. However, it provides context for potential inning projections and expectations from a volume standpoint. The other piece that isn’t quantified here involves the quality of the innings pitched since we didn’t include outcomes.
I’ve probably written or posted about the following starting pitchers, but still, proactive targets on some of the teams mentioned include Chris Sale, Ranger Suárez, Sonny Gray, Chase Burns, Nick Lodolo, Joey Cantillo, Hunter Brown, Mike Burrows, Kris Bubic, Max Fried, Ryan Weathers, Kirby, Gilbert, Luis Castillo, Ryan Pepiot, Jacob deGrom, MacKenzie Gore and Jack Leiter.
Pitcher Velocity Bands
After hearing about Jacob deGrom backing off his velocity last season and Spencer Strider working on pitch shapes in Spring Training, it led to digging into the percentage of pitches thrown at different velocity bands. The league average for pitches thrown at 94-97 mph was 16.1% in 2025. Meanwhile, the league-average for pitches thrown 97-100 mph in 2025 was 7.8%, the highest among the past three seasons (2023-2025). It’s a small sample, but we saw pitchers throwing the highest percentage of 100+ mph pitches (2.4%) in 2025.
Advertisement
This data is notable because pitchers who averaged over 15% of their pitches in the 97-100 mph range might have increased injury risk, like Hunter Greene, who will be out until July at the earliest due to bone chips in his elbow. We had 15 pitchers who averaged 15% or more pitches at 97-100 mph, including many with injury concerns. That list includes Sandy Alcantara, Dylan Cease, Gerrit Cole, Garrett Crochet, Greene, Dustin May, Shane McClanahan, Bobby Miller, Mason Miller, Shohei Ohtani, Eury Pérez, Grayson Rodriguez, Tarik Skubal, Spencer Strider and Gavin Williams.
.png)
Pitchers with 15% or more pitches at 97-100 mph (2023-2025). (Photo by Corbin Young/Yahoo Sports)
Besides Greene, Alcantara, Bobby Miller and Pérez averaged 30% or more of their pitches at 97-100 mph. Alcantara and Pérez missed 2024, while Miller missed 2025. Greene consistently threw pitches over 100 mph (16.9%), with Ohtani, Pérez and Skubal averaging over 1% of their pitches at 100 mph or more in 2025.
Advertisement
Among this list, we saw Strider and Crochet live significantly more often within the 94-97 mph range. However, Williams and Skubal saw a steep drop in the percentage points of pitches at 94-97 mph. Can pitchers like Strider and Brandon Woodruff find success with a significantly lower velocity in 2026? There’s a chance, but their draft prices tend to be relatively high, making them medium to high risks with moderate rewards if they struggle or miss time.