

What the recent performance of Atlanta Braves Holdings means for investors
Atlanta Braves Holdings (BATR.K) has caught investor attention after a mixed stretch, with a 0.4% move over the past day, a small decline over the past week, and a gain over the past 3 months.
See our latest analysis for Atlanta Braves Holdings.
That recent 0.45% 1 day share price return comes after a softer 7 day share price return of 0.86%. However, the 90 day share price return of 8% and 1 year total shareholder return of 6% show momentum that has held up over a longer stretch.
If this kind of move has you thinking about where else growth stories could emerge, it may be worth scanning 20 top founder-led companies
So, with the stock posting mixed short term returns, a recent 90 day gain of about 8%, and trading at a discount to an analyst price target of $58.60, is there a real opportunity here, or is the market already pricing in future growth?
Preferred Price-to-Sales of 3.7x: Is it justified?
On a simple P/S lens, Atlanta Braves Holdings looks expensive, with a 3.7x multiple that sits well above both its Entertainment industry peers and a modelled fair level.
The P/S ratio compares the company’s market value to its revenue and is often used when earnings are negative, as is the case here with a recent net loss of $23.37m on revenue of $732.49m. For a business tied to a single major sports franchise and a mixed use property development, a higher multiple can sometimes reflect expectations around future profitability or the scarcity value of the underlying assets.
Against that, the current 3.7x P/S stands sharply higher than the US Entertainment industry average of 1.4x and a peer average of 1.9x. It is also well above an estimated fair P/S of 0.8x that the market could potentially move toward if sentiment cools. Those gaps suggest investors are currently paying a substantial premium to both sector norms and a model based fair ratio for every dollar of revenue.
Explore the SWS fair ratio for Atlanta Braves Holdings
Result: Price-to-Sales of 3.7x (OVERVALUED)
However, the recent net loss of US$23.37m and reliance on a single sports franchise and one mixed use development leave the story exposed if sentiment or operating conditions weaken.
Find out about the key risks to this Atlanta Braves Holdings narrative.
Another angle using our DCF model
While the 3.7x P/S suggests a rich price tag, the SWS DCF model presents a different view, with an estimate of future cash flow value at $10.94 per share compared with the current $42.54. That indicates the shares may be expensive on a cash flow basis as well, so what factors could potentially close that gap over time?
Look into how the SWS DCF model arrives at its fair value.
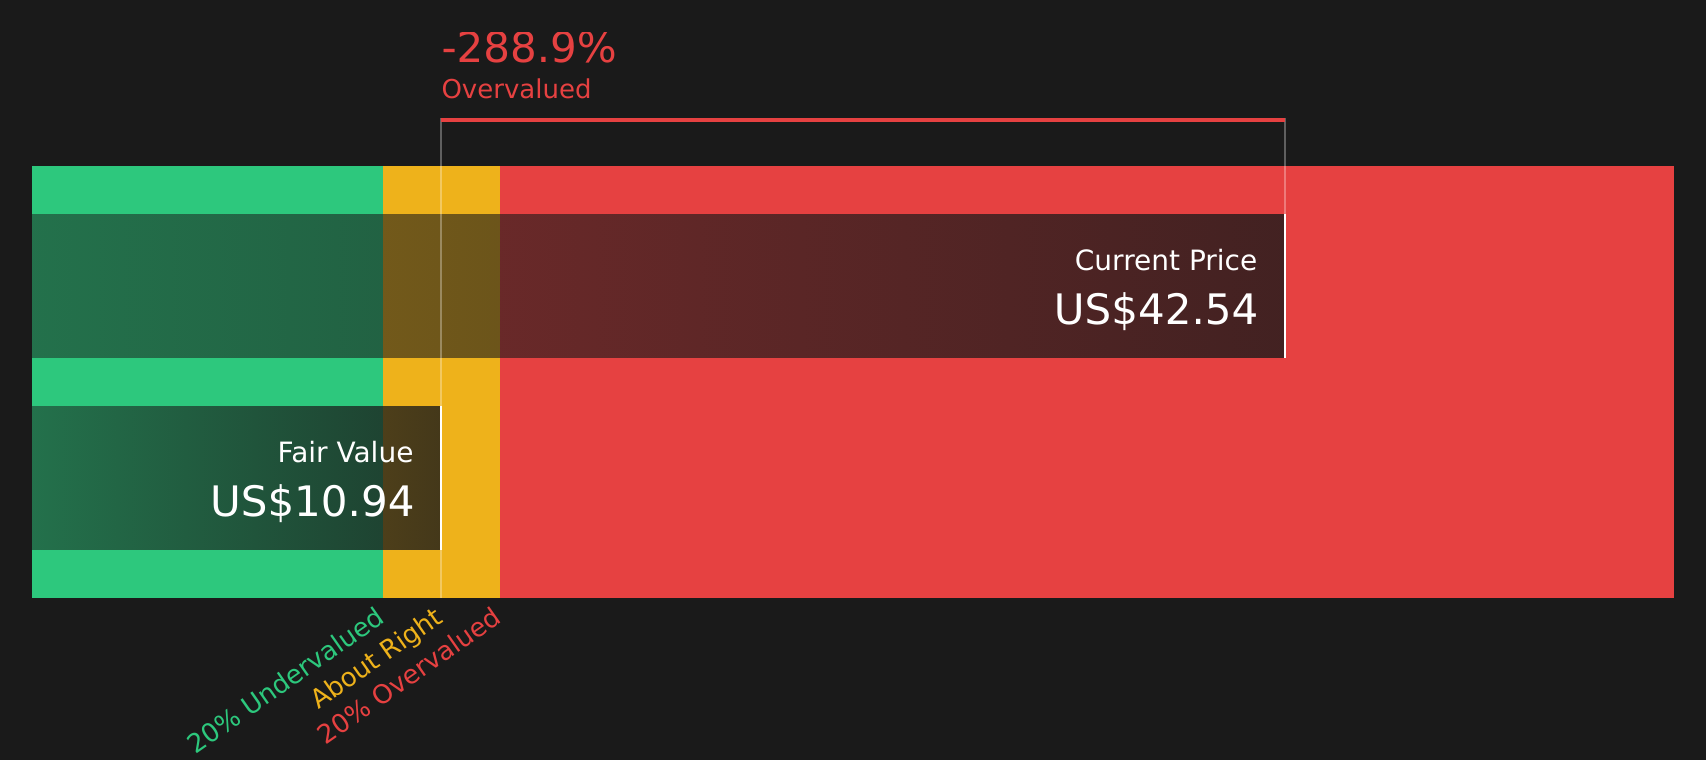 BATR.K Discounted Cash Flow as at Mar 2026
Simply Wall St performs a discounted cash flow (DCF) on every stock in the world every day (check out Atlanta Braves Holdings for example). We show the entire calculation in full. You can track the result in your watchlist or portfolio and be alerted when this changes, or use our stock screener to discover 55 high quality undervalued stocks. If you save a screener we even alert you when new companies match – so you never miss a potential opportunity.
Next Steps
Seeing mixed signals so far and wondering what really matters most for your own decision? Act while the details are fresh and weigh both sides using the 2 key rewards and 1 important warning sign
Looking for more investment ideas?
If this review has sharpened your thinking, do not stop here. Broaden your watchlist with focused stock ideas that could bring very different strengths to your portfolio.
Target potential mispricings by scanning 55 high quality undervalued stocks that combine solid fundamentals with prices that may not fully reflect their underlying businesses. Strengthen your portfolio’s income potential by searching 12 dividend fortresses built around higher yielding companies that still aim to keep payouts supported. Prioritize resilience by reviewing 74 resilient stocks with low risk scores designed to highlight companies with lower risk scores that might help balance more volatile holdings.
This article by Simply Wall St is general in nature. We provide commentary based on historical data
and analyst forecasts only using an unbiased methodology and our articles are not intended to be financial advice. It does not constitute a recommendation to buy or sell any stock, and does not take account of your objectives, or your
financial situation. We aim to bring you long-term focused analysis driven by fundamental data.
Note that our analysis may not factor in the latest price-sensitive company announcements or qualitative material.
Simply Wall St has no position in any stocks mentioned.
New: Manage All Your Stock Portfolios in One Place
We’ve created the ultimate portfolio companion for stock investors, and it’s free.
• Connect an unlimited number of Portfolios and see your total in one currency
• Be alerted to new Warning Signs or Risks via email or mobile
• Track the Fair Value of your stocks
Have feedback on this article? Concerned about the content? Get in touch with us directly. Alternatively, email editorial-team@simplywallst.com