
 Credit: Vincent Carchietta-Imagn Images
Before I get into analyzing what I think may be a relatively broken hitter, I have something to admit. This admission may sound familiar to you. Especially if you are at all impulsive. Or love to trade.
A few weeks back, after trading Corey Seager for Dylan Cease in what felt like an absolute coup, I got a bit ahead of my skis. Without looking at a single Fangraphs or Baseball Savant page, I fired an offer into the ether. I dealt away Michael King, Cade Cavalli, and Bo Bichette for Gunnar Henderson, in what felt like a classic buy low-sell high, where Henderson represented the low and King the high.
The point of this article is not to discuss King’s less than rosy peripherals. Nor is it to shame me for dealing Bichette before he seemingly started heating up. It is, at least in part, a cautionary tale, though I’d say it’s a hopeful one.
Do your research prior to making significant trades.
Not even because they could come back to haunt you, but just to maintain good process during your season. Inevitably, most of us will not win our leagues this year. But if we maintain a good process, one that includes researching players before trading for them, for example, then at least we can lose knowing that we did it the right way.
You Aren’t a FanGraphs Member
It looks like you aren’t yet a FanGraphs Member (or aren’t logged in). We aren’t mad, just disappointed.
We get it. You want to read this article. But before we let you get back to it, we’d like to point out a few of the good reasons why you should become a Member.
1. Ad Free viewing! We won’t bug you with this ad, or any other.
2. Unlimited articles! Non-Members only get to read 10 free articles a month. Members never get cut off.
3. Dark mode and Classic mode!
4. Custom player page dashboards! Choose the player cards you want, in the order you want them.
5. One-click data exports! Export our projections and leaderboards for your personal projects.
6. Remove the photos on the home page! (Honestly, this doesn’t sound so great to us, but some people wanted it, and we like to give our Members what they want.)
7. Even more Steamer projections! We have handedness, percentile, and context neutral projections available for Members only.
8. Get FanGraphs Walk-Off, a customized year end review! Find out exactly how you used FanGraphs this year, and how that compares to other Members. Don’t be a victim of FOMO.
9. A weekly mailbag column, exclusively for Members.
10. Help support FanGraphs and our entire staff! Our Members provide us with critical resources to improve the site and deliver new features!
We hope you’ll consider a Membership today, for yourself or as a gift! And we realize this has been an awfully long sales pitch, so we’ve also removed all the other ads in this article. We didn’t want to overdo it.
Now, for the analysis I should have done a few weeks ago, using an amazing tool that comes courtesy of the FanGraphs Lab.
Gunnar Henderson turns 25 years old next month. In his three full seasons between 2023 and 2025, the face of the Baltimore Orioles has gone from top prospect to star, averaging 27 home runs, 101 runs, 80 RBI, 20 steals per season while maintaining a .271 AVG.
That production isn’t what made him a consensus first round pick last season. And it isn’t what made him a consensus second round pick this season.
It’s moments like these.
It’s the promise of more.
Early in his career, Henderson’s growth seemed completely linear, akin to his Team USA teammate and ascendant shortstop, Bobby Witt Jr. They were poised to be the future of the league.
Henderson’s first full rookie season was followed up by a massive start to the 2024 season. In the first half alone, he clubbed 28 home runs with 14 steals while hitting .286. His Savant page was covered in red. He had arrived.
The second half brought a taste of failure, if you can call 9 home runs and a .273 AVG failure. Really, it brought him from the stratosphere back down to Earth with the rest of the league. Really, that may have brought him back to his baseline. His results from the second half of 2024, when extrapolated over a full season, look very similar to his season line from 2025.
In what was a particularly down year in Baltimore, Henderson hit just 17 home runs, though he did nab 30 bags and continue hitting for a respectable .274 AVG.
Injuries explained away much of this downturn. It came out during the offseason that the young shortstop, who began the 2025 season on the IL with a right intercostal strain, had also been dealing with a left shoulder impingement for a good chunk of the season.
This season, he came into camp presumably healthy, playing capably at multiple positions for Team USA during the World Baseball Classic. But the numbers have not rebounded.
In fact, he seems to have made a dramatic change to his approach.
Up until this season, Henderson was a bit of a groundball guy. He would hit the ball on the ground more than half of the time and he’d hit it squarely when he did.
Now, that approach seems to have changed. Following what seems to be a growing trend across the majors, Henderson is now one of the league leaders in pull air rate.
Fangraph’s Squared Up Explorer tool does a great job illustrating the change in batted ball data.
Let’s start with the period of time when Gunnar (which is what it feels like we should call the superstar version) slammed 28 home runs in the first half of 2024.

On the x-axis is how often Gunnar squared up the ball. On the y-axis are the launch angles of those batted balls. The larger the dot, the more frequently Gunnar achieved that combination of launch angle and squared-up rate. The red shaded area represents the launch angle range most ideal for hitting home runs. Which again, he hit 28 of during the above period.
While he clearly hit more ground balls than line drives and fly balls during this period, the flyballs he did hit met two key conditions. He mostly hit line drives or fly balls within the ideal launch angle range. And when he did hit balls in the air, he squared them up more than 80% of the time.
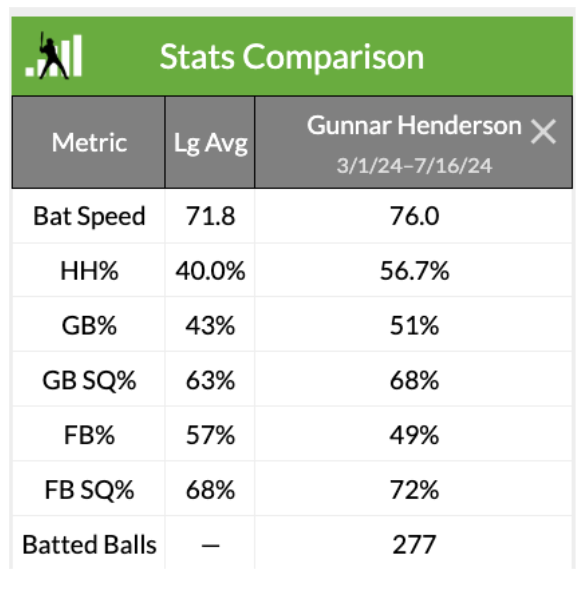
When you use the Fangraphs Squared Up Explorer tool, you’ll notice this “Stats Comparison” box next to the graphed output. In this case, these metrics are extremely productive, acting like the red Savant lollipops by comparing Gunnar’s results to league average during that period.
As you can see, his bat speed and hard hit rate were both solidly above league average. He mostly hit the ball on the ground and squared it up more than the average hitter when he did. He squared up his fly balls more than the average hitter too.
The Squared Up Explorer allows you to compare multiple seasons, or portions of seasons. You can compare players and seasons until the full gamut of the rainbow is represented. In the chart below, I compared the red hot “Gunnar” start to the 2024 season (the blue) to Henderson’s second half of 2024 through 2025 (the gold).

This shows a clear change in results for our hero. While still engaging in the ground and pound approach, less of Henderson’s flyballs fell into the ideal launch angle band for hitting home runs. Those flyballs that were hit at that ideal angle were squared up much less frequently than they were during his hot start in 2024.
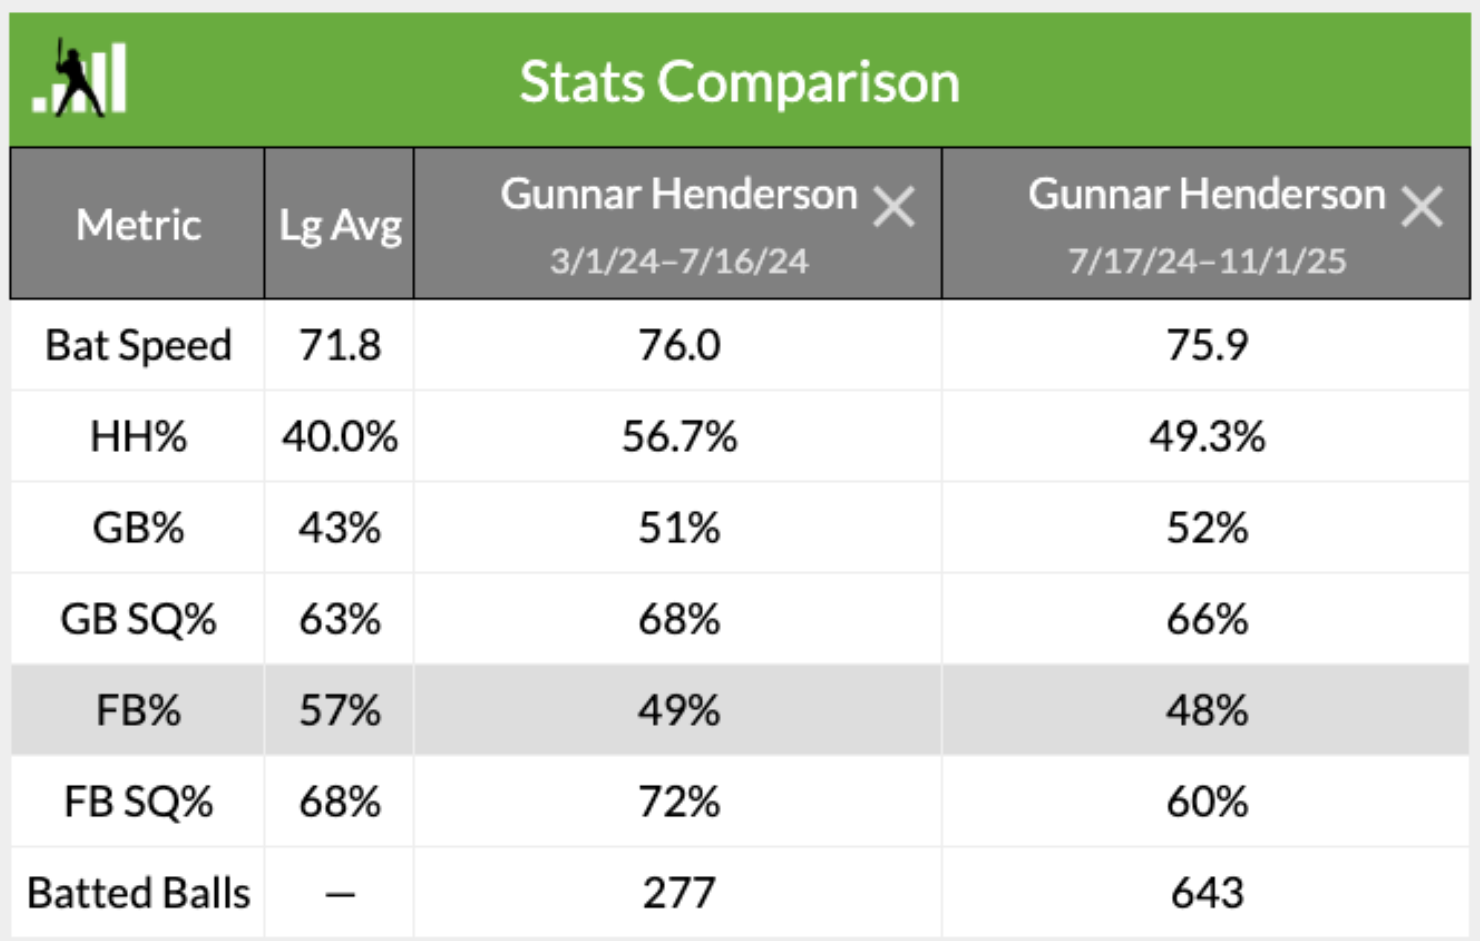
Again, the provided comparison does a good job illustrating what you see in the visualization, while also providing bat speed and hard hit rate data.
For Henderson, through the 2025 season, he was able to maintain his bat speed and not meaningfully alter his batted ball profile, except for one key difference. He squared up just 60% of his flyballs, compared to a league average of 68% and his own high water mark of 72% from that red hot first half.
Fast forward to this season. The one where he came in reportedly healthy. The one where he announced himself with a pulled moonshot off of Luis Severino to tie the game for Team USA during their eventual win in the semifinals against the Dominican Republic (where of course ABS should have been applied, but that’s another story).
So far, he’s struggled mightily. Through May 19, Henderson does have 10 home runs with 6 steals, but is hitting an uncharacteristically low .211. Remember, he came into the season averaging 27 home runs per full season over the last three years with a robust .271 AVG. He’s also striking out more than ever and walking less than ever. Not a great combination.
To find out what’s going on under the hood, let’s turn back to the Squared Up Explorer.
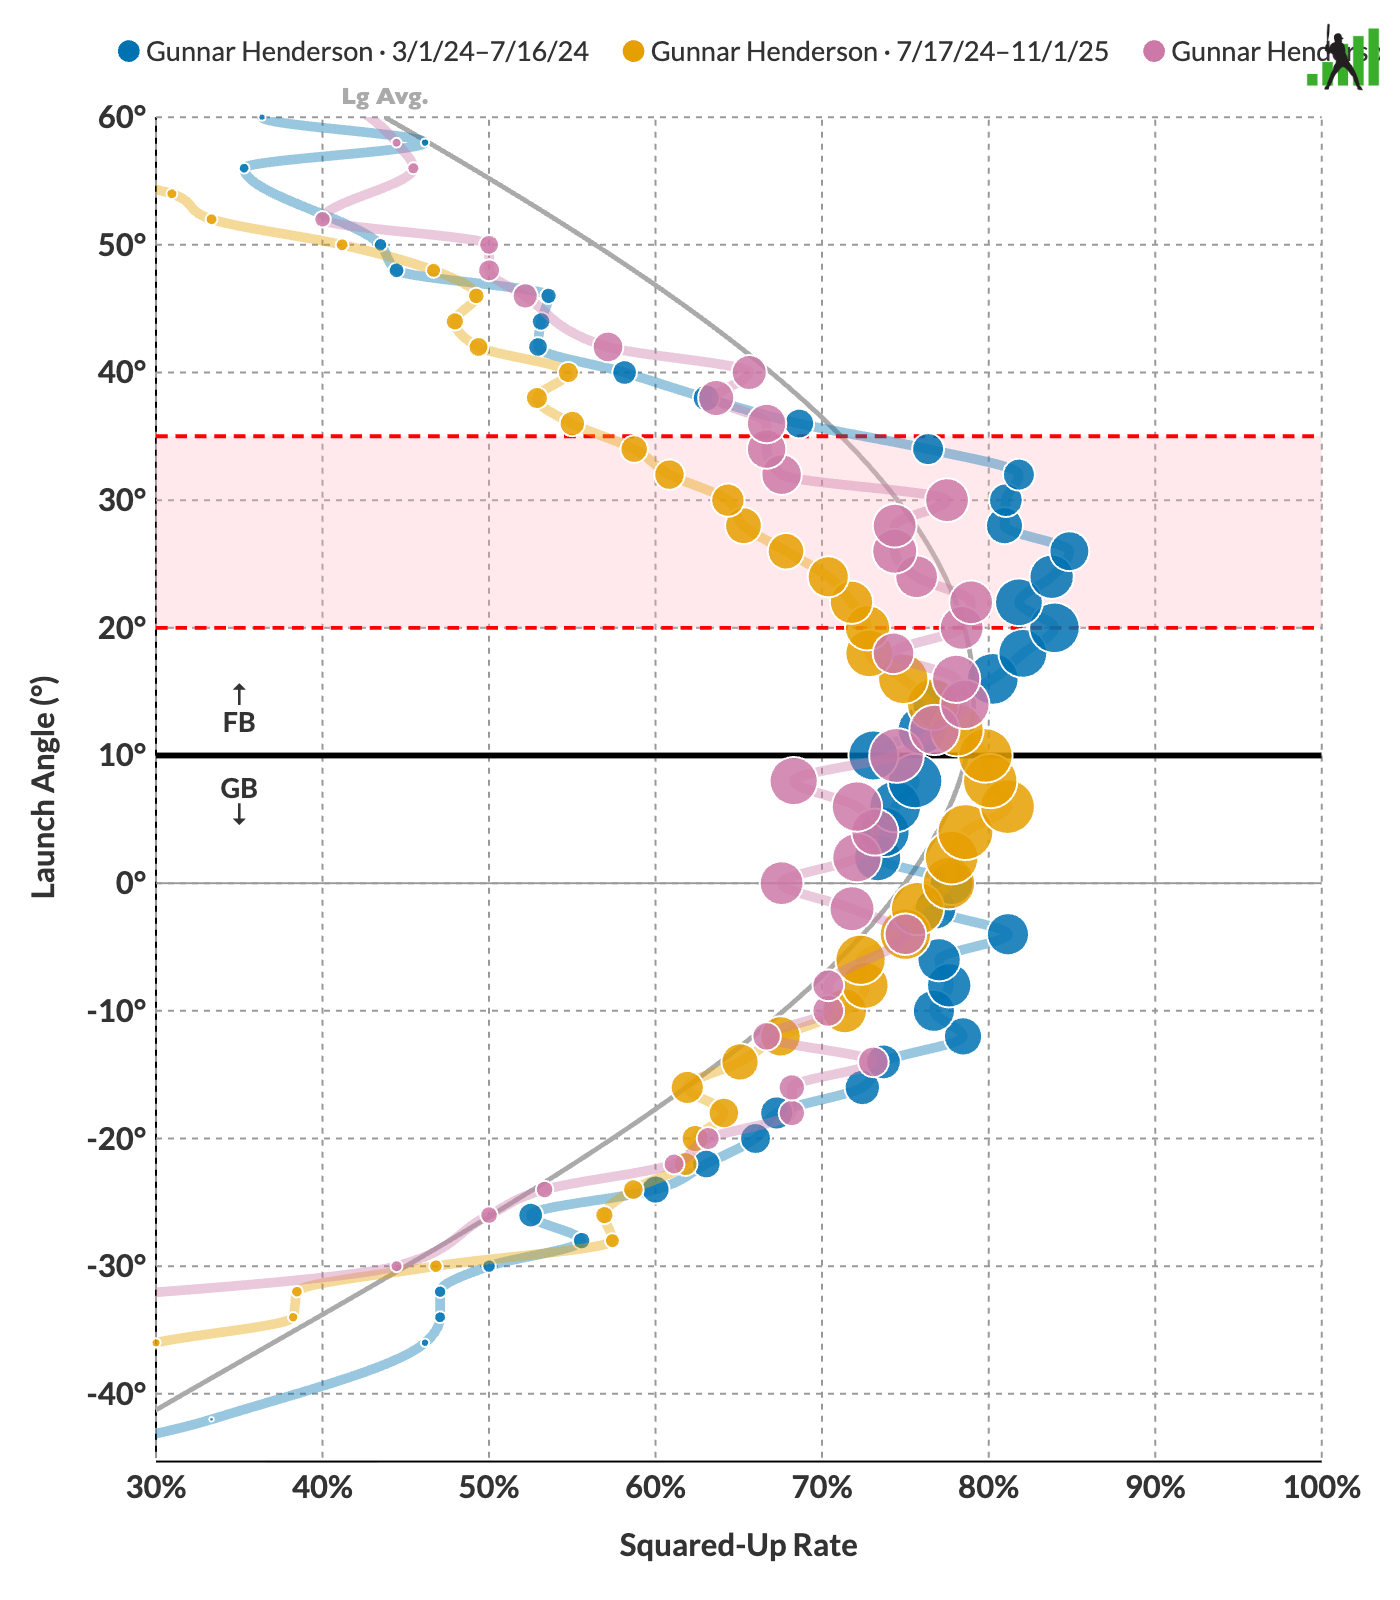
So far this season (shown in pink), we can see from the chart that Henderson is hitting the ball in the air more frequently and that he’s hitting it within the ideal band of angles for home runs more frequently as well (note that the size of the dots represent frequency of this type of batted ball event). This change has not brought him back to 2024 levels of squared up rate though.
Given the overlapping nature of the dots, this graphic becomes a bit challenging to read. This is where the stats comparison chart comes in handy.

With this added bat speed and hard hit rate context, the picture becomes a bit more complete.
Comparing 2026 to the best stretch of his career. Henderson’s bat speed is down 1.5 miles per hour, his hard hit rate is down more than 11 percentage points, and he’s traded a heavy groundball approach for one that emphasizes lifting the ball, while continuing to square up the ball at a rate that is mostly in line with his peak stretch in 2024.
As noted in the Squared Up Explorer glossary, “Different swings produce optimal contact at different elevations, and depending on swing speed, squaring the ball up can produce varying results. Faster swings produce better results on squared-up aerial contact, and those are the most valuable swings in baseball.”
The provided stats comparison helps explain some of Henderson’s weaker results so far this season. He is not swinging as hard on average, squaring the ball up is not leading to as many hard hit balls.
But this doesn’t tell the full story. I think there are two noticeable changes in Henderson’s results that are important to monitor going forward.
There is a ample research, including this article from our own Chad Young, describing how pulling fly balls helps hitters unlock latent power. Anecdotally, the success of Alex Bregman, Isaac Paredes, Nolan Arenado, and many others has largely been explained by the ability to pull one’s fly balls.
In Henderson, I see a cautionary tale to assuming that this strategy will always lead to success. Because even as he is “doing the thing” that many may say is the most sure fire way to access home run power, he is sacrificing so much of what made him great to do that.
Let’s turn to Statcast. Since 2024, Statcast has introduced a suite of bat tracking metrics, including the aforementioned average bat speed measure. But Statcast also now tracks what percentage of your swings reach the 75 mph threshold (Fast Swing %) and what percentage of your swings are considered “Blasts”, which are batted balls that meet the fast swing condition and are squared up. Blasts are extremely rare and describe most of the swings where damage done by hitters.
In short, you want to Blast the ball.
Gunnar is Pulling a Fast One, Instead of a Blast One
Season
FB%
HR/FB
Fast Swing%
Blast Swing%
Pull Air%
2024
32.6%
23.9%
64.5%
17.9%
14.9%
2025
31.0%
12.3%
53.4%
15.7%
15.3%
2026
40.8%
17.2%
44.3%
11.2%
28.2%
Source: Baseball Savant
Notice the dramatic increase in pull air rate and the dramatic decrease in fast swing rate and blast swing rate. Henderson is masking the diminishing frequency of his blasts by pulling the ball in the air. This is helping pull his HR/FB up towards 2024 levels.
Clearly though, this is not the optimal version of Gunnar.
His .211 AVG this season is backed up by a .225 xBA and .250 BABIP. For context, Henderson is a career .264 hitter with a .265 xBA and .313 BABIP. This is partially due to his old approach, where he would spray hard ground balls and line drives and run really fast.
He still has 76th percentile sprint speed, but it doesn’t matter how fast you run when the ball is lofted out to right and doesn’t clear the fence. Sure, it also doesn’t matter how fast you are when you hit it over the fence. But he isn’t doing that more often than he did during his peak either.
Ultimately, we tend to bet on this sort of player to bounce back. Young budding super stars struggle sometimes. Julio Rodriguez has cold stretches that last for months. Fernando Tatis Jr. still has not hit a home run!
But it’s worth noting when a player is struggling and their approach changed, especially when it is likely because of that change that the struggle bus is a’rumbling.
I, for one, believe in Gunnar. Not just because I roster him in my must-win home league. But because betting on talent generally is right. Overreacting over bad results is generally wrong.
But there’s also a chance that we’re collectively giving him a pass because of how red hot he got for that glorious first half in 2024. He wasn’t the same player in the second half of that season. He wasn’t the same player for any of 2025. And so far this year, he isn’t even close to any previous version of himself.
Buyer beware.