
The Mariners are treading water as we enter June. After an 18-12 April, the Mariners went 13-14 in May. The rotation continued to exit games early, exposing a shallow and inconsistent bullpen. The heart of the lineup continued to mash, but the bottom of the order struggled to contribute. Still, the Mariners are 1-0 in June after Sunday’s walkoff, series-clinching win over the Twins. They now have an opportunity to “get right” with consecutive series against three of the league’s worst pitching staffs. First up are the Orioles, whose season can be described as “shocking.”
At a Glance
Orioles
Mariners
Orioles
Mariners
Game 1
Tuesday, June 3 | 6:40 pm
RHP Tomoyuki Sugano
RHP George Kirby
38%
62%
Game 2
Wednesday, June 4 | 6:40 pm
LHP Cade Povich
RHP Emerson Hancock
51%
49%
Game 3
Thursday, June 5 | 12:40 pm
RHP Zach Eflin
RHP Bryan Woo
42%
58%
*Game odds courtesy of FanGraphs
Team Overview
Overview
Orioles
Mariners
Edge
Overview
Orioles
Mariners
Edge
Batting (wRC+)
97 (10th in AL)
111 (2nd in AL)
Mariners
Fielding (OAA)
-10 (14th)
-9 (13th)
Mariners
Starting Pitching (FIP-)
125 (14th)
97 (7th)
Mariners
Bullpen (FIP-)
114 (13th)
107 (11th)
Mariners
In some ways, the Orioles feel like an extreme version of the Mariners. The timelines of both builds are similar, and the inflections are roughly the same. But where the Mariners have steadily climbed from one end of mediocrity to the other, the Orioles have swung from extreme lows to extreme highs and back again. From 2018 to 2021, the Orioles carried out a ruthless tank, with an average record of 52-110 over four seasons (including 2020). They were rewarded for this lack of effort with a handful of preternatural prospects, who instantly changed the direction of the franchise. The Orioles won 101 games in 2023 and 91 games in 2024. Even after two winless postseasons, they looked like the Next Big Thing in the American League. Then came the 2025 offseason. The Orioles allowed a few key players to walk in free agency and “bolstered” their core with a raft of aging, injury-prone veterans on short-term deals. The projections were down, and the vibes were off. The offseason was marked by hard feelings amongst ownership, the front office, the media and the fans.
The Orioles are now 22-36 and 14 games out of first place. Their -93 run differential is the third worst in MLB. They currently hold the top spot on the Baseball Prospectus injury dashboard with 4.3 WARP missed due to injury, or about 10% of their team’s total projected value. That number will continue to grow, with 11 players currently on the injured list. The bottoming out may be over, however, as the Orioles are 7-7 since firing their manager on May 17. They just completed a narrow sweep of the White Sox in Baltimore. But these Orioles are not good, and they’re not the same team that has won four consecutive series against the Mariners since 2023.
Orioles Lineup
Player
Position
Bats
PA
K%
BB%
ISO
wRC+
Player
Position
Bats
PA
K%
BB%
ISO
wRC+
Jackson Holliday
2B
L
207
22.7%
4.8%
0.171
118
Adley Rutschman
C
S
213
17.4%
11.7%
0.128
86
Gunnar Henderson
SS
L
223
26.5%
8.1%
0.176
115
Ryan O’Hearn
1B
L
197
15.7%
11.7%
0.206
175
Colton Cowswer (2024)
CF
L
561
30.7%
9.3%
0.204
120
Ramón Urías
3B
R
147
19.7%
8.8%
0.085
101
Coby Mayo (AAA)
DH
R
195
27.2%
11.8%
0.226
105
Dylan Carlson
LF
S
54
31.5%
5.6%
0.180
84
Heston Kjerstad
RF
L
156
28.2%
3.2%
0.123
52
The Orioles lineup has scored the sixth fewest runs in MLB, and they have the third worst walk-to-strikeout ratio, but they look closer to average by broader run-scoring estimates. Ryan O’Hearn leads the heart of the Orioles lineup with a 175 wRC+; he’s tied with Cal Raleigh for 12th on the xwOBA leaderboard (.408). Jackson Holiday, now 21, appears to have put a poor rookie season behind him, and he’s one of the few encouraging signs for the Orioles this year. Portland-native Adley Rutschman has started slow and ceded his status as “best catcher in MLB,” although his .353 xwOBA suggests he’s been quite “unlucky.” The same misfortune appears true of Heston Kjerstad, who’s tied for second least fWAR in MLB (-1.1) despite OK-ish peripherals. But poor luck doesn’t appear to be the case for Gunnar Henderson, whose significant leap in strikeout rate has him on pace to produce less than half of his 8-win season from a year ago. Other names I thought to mention — Jordan Westburg, Ramón Laureano, Cedric Mullins, Tyler O’Neill, and more — are on the IL.
Probable Pitchers
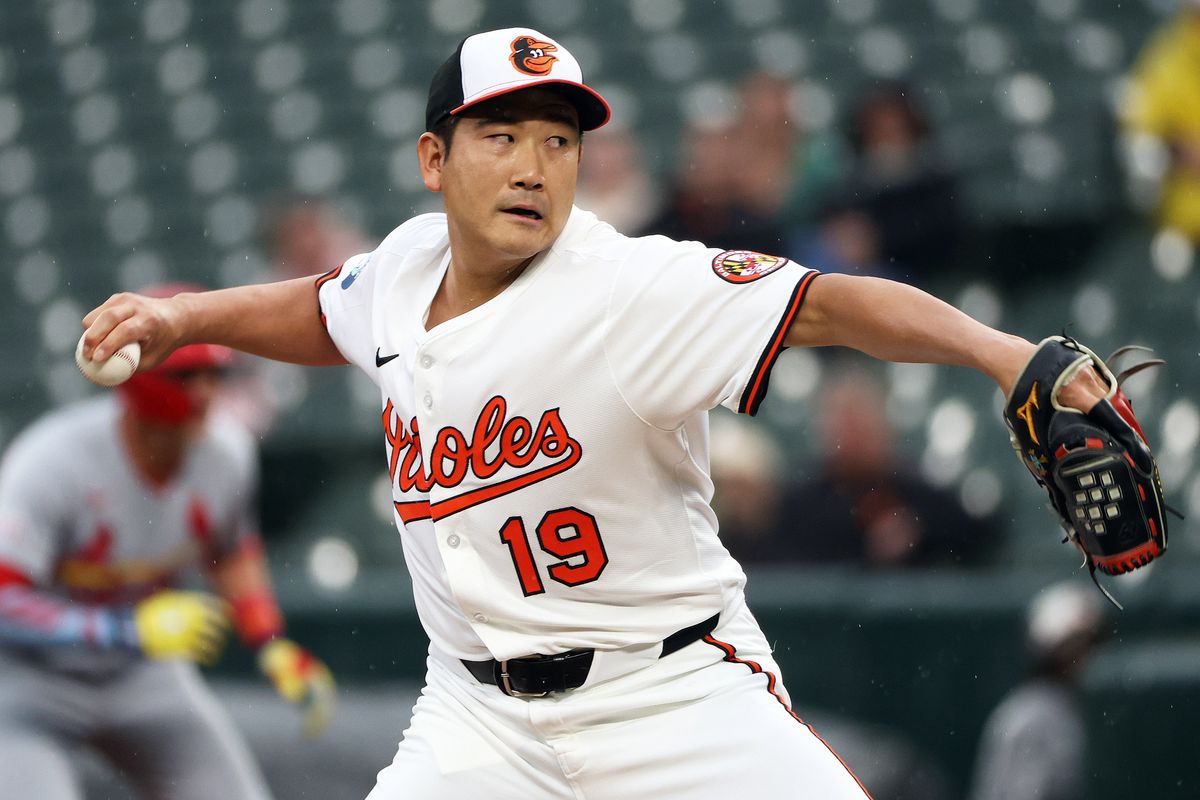
Daniel Kucin Jr.-Imagn Images
Game 1 Pitching Matchup
Pitcher
IP
K%
BB%
HR/FB%
GB%
ERA
FIP
Pitcher
IP
K%
BB%
HR/FB%
GB%
ERA
FIP
Tomoyuki Sugano
64
13.7%
3.9%
13.6%
43.8%
3.23
4.78
George Kirby (2024)
191
23.0%
3.0%
9.6%
41.3%
3.53
3.26
RHP Tomoyuki Sugano
Pitch
Frequency
Velocity
Stuff+
Whiff+
BIP+
xwOBA
Pitch
Frequency
Velocity
Stuff+
Whiff+
BIP+
xwOBA
Four-seam
15.9%
92.4
99
80
114
0.353
Sinker
12.3%
92.2
87
71
73
0.478
Cutter
16.5%
87.6
90
38
108
0.369
Splitter
24.8%
87.0
81
79
113
0.250
Curveball
11.2%
77.7
86
34
64
0.593
Sweeper
19.4%
82.9
108
47
108
0.268
After a long and successful career in Japan, Tomoyuki Sugano made the jump from NPB to MLB this offseason. He’s quickly adapted to his new environment and has arguably been the Orioles best starter this year. That’s a bit of a problem because I’m sure Baltimore was expecting Sugano to be more of a back-end starter rather than their frontline ace. To his credit, he’s used his deep repertoire to keep batters off balance, even if he’s not necessarily dominating the competition. His strikeout rate is one of the lowest among qualified starters and he’s mostly surviving by inducing a ton of weak contact. It’s worked so far — his ERA is more than a full run below his FIP — but the sustainability of that kind of profile isn’t very strong.
Game 2 Pitching Matchup
Pitcher
IP
K%
BB%
HR/FB%
GB%
ERA
FIP
Pitcher
IP
K%
BB%
HR/FB%
GB%
ERA
FIP
Cade Povich
51
23.5%
8.8%
14.8%
39.9%
5.29
4.47
Emerson Hancock
44.2
16.2%
7.6%
16.7%
44.6%
5.64
5.12
LHP Cade Povich
Pitch
Frequency
Velocity
Stuff+
Whiff+
BIP+
xwOBA
Pitch
Frequency
Velocity
Stuff+
Whiff+
BIP+
xwOBA
Four-seam
35.7%
92.2
99
85
55
0.458
Sinker
13.0%
91.6
97
137
36
0.355
Changeup
13.5%
83.6
92
115
218
0.251
Curveball
20.6%
77.9
95
91
94
0.329
Sweeper
14.4%
82.3
98
50
107
0.444
Cade Povich entered last season as the Orioles top pitching prospect which isn’t saying much since most of Baltimore’s development efforts have gone towards their huge stable of young position players. He made 16 mostly unremarkable starts in the big leagues last year and has taken a few small steps forward this season. His deep repertoire and funky mechanics make him uncomfortable to face but the lack of raw stuff on his pitches undermines any benefits he gets from his pitch mix and delivery. He’s got two decent breaking balls and a changeup that’s improved by leaps and bounds over the last year.
Game 3 Pitching Matchup
Pitcher
IP
K%
BB%
HR/FB%
GB%
ERA
FIP
Pitcher
IP
K%
BB%
HR/FB%
GB%
ERA
FIP
Zach Eflin
40.1
14.9%
3.7%
16.4%
38.3%
4.46
5.38
Bryan Woo
70.1
22.8%
3.3%
8.2%
39.8%
2.82
3.05
RHP Zach Eflin
Pitch
Frequency
Velocity
Stuff+
Whiff+
BIP+
xwOBA
Pitch
Frequency
Velocity
Stuff+
Whiff+
BIP+
xwOBA
Four-seam
13.3%
91.6
87
Sinker
20.3%
91.4
99
95
97
0.252
Cutter
22.0%
88.1
90
60
64
0.352
Changeup
14.8%
86.6
85
Curveball
15.4%
77.7
107
Sweeper
14.3%
79.0
102
The Orioles acquired Zach Eflin at the trade deadline last year after he had enjoyed a mid-career breakout with the Rays. I feel like a bit of a broken record here, but Eflin has a deep repertoire that features two different breaking balls and three different fastballs. He’s increased the usage of his changeup and sweeper this year so that all of his pitches fall within a 13–22% usage rate. He missed about a month of the season with a lat strain and has been hit hard since his return. None of the underlying stats on his individual pitches looks out of place and his abnormally low 14.9% strikeout rate lags behind what we’d expect based on his chase rate and swinging strike rate.
The Big Picture:
AL West Standings
Team
W-L
W%
Games Behind
Recent Form
Team
W-L
W%
Games Behind
Recent Form
Mariners
32-26
0.552
—
L-L-L-W-W
Astros
32-27
0.542
0.5
W-L-W-L-W
Rangers
29-31
0.483
4.0
W-L-W-L-W
Angels
27-32
0.458
5.5
L-W-L-L-W
Athletics
23-38
0.377
10.5
L-L-L-L-L
AL Wild Card Standings
Team
W-L
W%
Games Behind
Recent Form
Team
W-L
W%
Games Behind
Recent Form
Guardians
32-26
0.552
+0.5
L-W-L-W-W
Astros
32-27
0.542
—
W-L-W-L-W
Twins
32-27
0.542
—
L-W-L-L-W
Blue Jays
31-28
0.525
0.5
W-W-W-W-W
Royals
31-29
0.517
1.0
L-W-L-W-L
Rays
30-29
0.508
1.5
W-W-L-W-L
The Mariners maintained their slim lead over the Astros with their two wins last weekend. Meanwhile, Houston split a really weird series with the Rays in which they were outscored 29-6 in the two losses, while the two wins were one-run affairs in which just four total runs were scored. The ‘Stros head to Pittsburgh this week to take on the Pirates. The Rangers won their series against the Cardinals last weekend and will head to Tampa to face the Rays this week.