
The Mariners customary late-spring swoon has arrived in force. Last year, it didn’t happen until July (10-14 that month), in ‘23 it was June (9-15), and in ‘22 it was May (10-18). The two walk-off wins against the Twins last weekend papered over what was a pretty miserable homestand. There were no home comforts to be found in T-Mobile Park in May and June. The M’s have gone 4-11 in 15 home games over the past month and change with a -37 run differential. They went 10-6 on the road during the same stretch. Let’s hope they continue that solid play on this short road trip through Los Angeles and Arizona.
At a Glance
Mariners
Angels
Mariners
Angels
Game 1
Friday, June 6 | 6:38 pm
RHP Bryce Miller
RHP Kyle Hendricks
58%
42%
Game 2
Saturday, June 7 | 6:38 pm
RHP Luis Castillo
RHP Jack Kochanowicz
58%
42%
Game 3
Sunday, June 8 | 1:07 pm
RHP George Kirby
LHP Tyler Anderson
58%
42%
*Game odds courtesy of FanGraphs
Team Overview
Overview
Angels
Mariners
Edge
Overview
Angels
Mariners
Edge
Batting (wRC+)
93 (12th in AL)
109 (3rd in AL)
Mariners
Fielding (OAA)
-8 (11th)
-8 (12th)
Angels
Starting Pitching (FIP-)
115 (12th)
99 (7th)
Mariners
Bullpen (FIP-)
122 (15th)
107 (12th)
Mariners
The season is only a little over a third of the way through, but the Angels have already endured a wild up-and-down year. They started off with a solid 9-5 record through mid-April, won just eight of their next 28 games, strung together an eight game win streak to get them back to .500, and then won just three of their next 11 games. That Jekyll and Hyde performance is thanks to an offense that has run really hot during their good stretches and really cold during their slumps. They’ve also gone 10-15 at home while scoring just 3.5 runs per game with a 34 point wOBA split between their home and road performance.
Angels Lineup
Player
Position
Bats
PA
K%
BB%
ISO
wRC+
Player
Position
Bats
PA
K%
BB%
ISO
wRC+
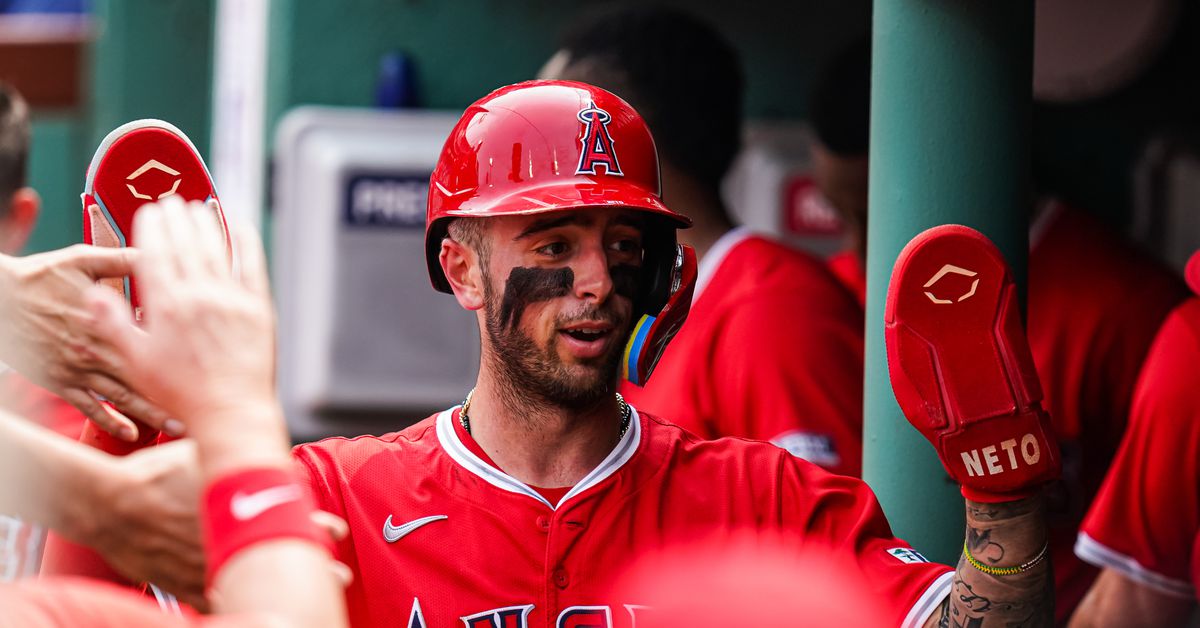
Zach Neto
SS
R
185
29.2%
4.3%
0.247
132
Nolan Schanuel
1B
L
243
12.3%
13.6%
0.108
118
Mike Trout
DH
R
145
26.2%
10.3%
0.268
120
Taylor Ward
LF
R
257
27.2%
7.0%
0.274
103
Jorge Soler
RF
R
234
27.8%
8.5%
0.163
89
Logan O’Hoppe
C
R
197
34.5%
4.1%
0.235
113
Luis Rengifo
3B
S
202
15.8%
4.5%
0.053
39
Jo Adell
CF
R
181
24.3%
6.1%
0.206
96
Chris Taylor
2B
R
54
38.9%
1.9%
0.057
10
The Angels activated Mike Trout off the IL about a week ago and he’s quickly made up for lost time by collecting a hit in all six games since returning from his knee injury. That’s pushed his wRC+ up to 120 on the season and the Angels have committed to playing him at designated hitter a lot more often in the hopes that that will keep him healthy and on the field. The other big positive has been the continued development of Zach Neto. He’s significantly improved his power output thanks to some fantastic batted ball metrics. The plate discipline still leaves a lot to be desired, but if he can continue pounding the ball when he does make contact, he should secure a place as one of the best shortstops in the AL. One last note: yes, that’s former-Mariner turned Dodger Chris Taylor bringing up the rear of the Angels lineup. He was released by the other LA team in mid-May and signed with the lesser LA team a few days later. His 10 (not a typo) wRC+ indicates he’s thoroughly cooked.
Probable Pitchers
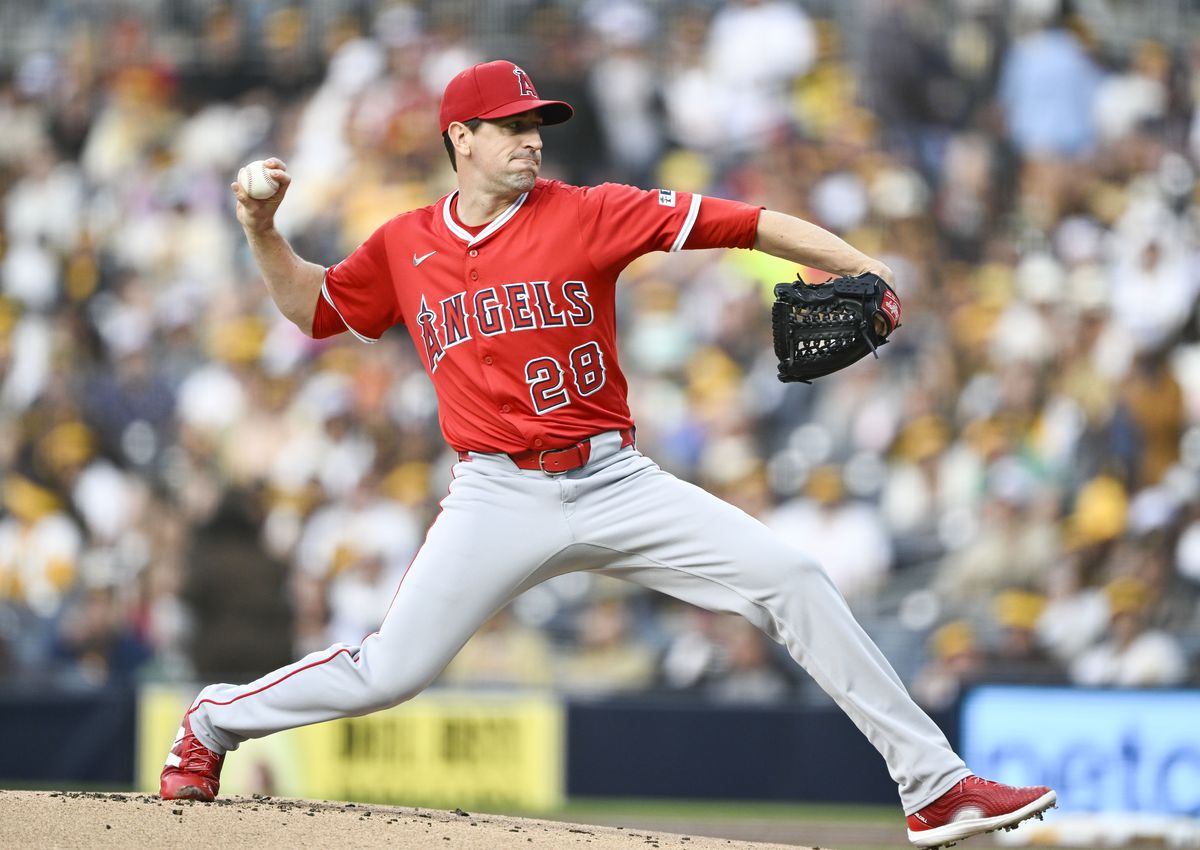
Denis Poroy-Imagn Images
Game 1 Pitching Matchup
Pitcher
IP
K%
BB%
HR/FB%
GB%
ERA
FIP
Pitcher
IP
K%
BB%
HR/FB%
GB%
ERA
FIP
Kyle Hendricks
59
15.5%
7.2%
12.6%
37.9%
5.34
5.29
Bryce Miller
43.2
19.2%
11.4%
7.5%
34.4%
5.36
4.22
RHP Kyle Hendricks
Pitch
Frequency
Velocity
Stuff+
Whiff+
BIP+
xwOBA
Pitch
Frequency
Velocity
Stuff+
Whiff+
BIP+
xwOBA
Four-seam
15.8%
86.5
71
84
127
0.368
Sinker
35.4%
86.2
86
64
95
0.327
Changeup
36.1%
79.2
82
70
136
0.276
Curveball
12.7%
71.9
78
61
52
0.540
For some reason, the Angels chose to sign Kyle Hendricks to a one-year deal this offseason. Something about a veteran presence and eating a bunch of innings while the Angels continue to develop some of their young pitching prospects. Things have gone about as well as could be expected for the 35-year-old soft tosser. He relies on command and guile to try and deceive opposing batters but his pitches have degraded in quality so much that it doesn’t really matter.
Game 2 Pitching Matchup
Pitcher
IP
K%
BB%
HR/FB%
GB%
ERA
FIP
Pitcher
IP
K%
BB%
HR/FB%
GB%
ERA
FIP
Jack Kochanowicz
64
15.5%
11.3%
15.2%
50.0%
5.34
5.46
Luis Castillo
68.1
19.1%
8.0%
4.8%
41.1%
3.03
3.28
RHP Jack Kochanowicz
Pitch
Frequency
Velocity
Stuff+
Whiff+
BIP+
xwOBA
Pitch
Frequency
Velocity
Stuff+
Whiff+
BIP+
xwOBA
Four-seam
19.0%
95.7
85
103
95
0.365
Sinker
47.6%
95.5
98
106
97
0.356
Changeup
10.1%
89.6
83
83
98
0.295
Slider
16.1%
87.3
96
93
89
0.396
Sweeper
7.2%
82.3
96
From a previous series preview:
Jack Kochanowicz debuted last season as a classic sinkerballer, making 11 starts with an ERA just a hair under four. I used the word “classic” purposefully above because there was nothing modern about Kochanowicz’s approach or pitch mix. He threw his bowling ball sinker nearly three-quarters of the time and that resulted in a single digit strikeout rate. His K/9 started with a three. He did benefit from a ton of groundball contact, but he just couldn’t miss bats. This year, Kochanowicz has dropped the usage of his sinker down to just over 50% in favor of his four-seamer and slider. The results aren’t that promising; his strikeout rate now has a second digit, but it’s only up to 15.5%, and his walk and groundball rates have both trended the wrong way.
Kochanowicz allowed three runs in six innings in his last outing against the Mariners. He allowed four hits and four walks while striking out six.
Game 3 Pitching Matchup
Pitcher
IP
K%
BB%
HR/FB%
GB%
ERA
FIP
Pitcher
IP
K%
BB%
HR/FB%
GB%
ERA
FIP
Tyler Anderson
65.1
18.1%
9.2%
10.4%
29.7%
3.86
4.99
George Kirby
13.2
16.9%
6.2%
21.4%
47.9%
8.56
5.64
LHP Tyler Anderson
Pitch
Frequency
Velocity
Stuff+
Whiff+
BIP+
xwOBA
Pitch
Frequency
Velocity
Stuff+
Whiff+
BIP+
xwOBA
Four-seam
39.7%
88.8
92
70
89
0.362
Sinker
2.2%
87.7
Cutter
21.1%
83.7
96
71
104
0.302
Changeup
33.3%
78.1
101
133
98
0.289
Slider
3.2%
79.5
From a previous series preview:
Way back in 2022, Tyler Anderson enjoyed a late-career breakout with the Dodgers thanks to a revamped changeup. That pitch has continued to hold the foundation of his repertoire in the three years since but his overall results have flagged since joining the Angels. The two other ingredients of his breakout — a 4.8% walk rate and a 6.4% home run rate — have both ballooned in Anaheim, which has led to an ERA and FIP both above four. At this point in his career, he’s a known entity: try to avoid his changeup, crush his four-seamer, and let him get himself into trouble.
Like Kochanowicz, Anderson allowed three runs in six innings back in late-April in Seattle.
The Big Picture:
AL West Standings
Team
W-L
W%
Games Behind
Recent Form
Team
W-L
W%
Games Behind
Recent Form
Astros
34-28
0.548
—
L-W-W-L-W
Mariners
32-29
0.525
1.5
W-W-L-L-L
Rangers
29-34
0.460
5.5
L-W-L-L-L
Angels
28-33
0.459
5.5
L-L-W-W-L
Athletics
24-40
0.375
11.0
L-L-L-L-W
AL Wild Card Standings
Team
W-L
W%
Games Behind
Recent Form
Team
W-L
W%
Games Behind
Recent Form
Twins
34-28
0.548
+1.0
L-W-W-W-L
Guardians
33-28
0.541
+0.5
W-W-L-W-L
Blue Jays
33-29
0.532
—
W-W-L-W-W
Rays
33-29
0.532
—
W-L-W-W-W
Mariners
32-29
0.525
0.5
W-W-L-L-L
Royals
33-30
0.524
0.5
W-L-W-L-W
Not only did the Mariners drop out of first place in the AL West following their sweep at the hands of the Orioles, they fell entirely out of a playoff berth. They’re now a half-game behind in the Wild Card race, tied with the Royals. The Astros won their series against the Pirates earlier this week and will travel to Cleveland this weekend. Meanwhile. the Rangers were swept by the Rays and head to Washington to take on the Nationals. The Athletics finally won a game! They’ve gone 4-24 since that walk-off win against the Mariners on May 5.