
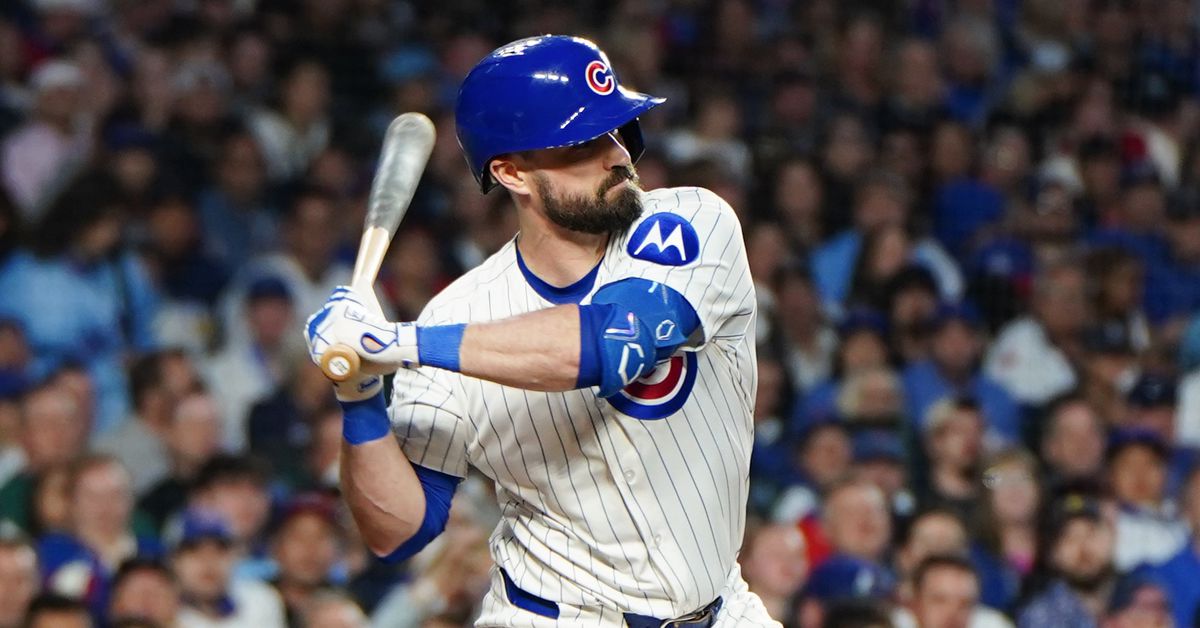
The Cubs got off to a hot start despite the toughest schedule in baseball in April but there are still big question marks despite their three game lead in the division over the Cardinals and Brewers. There are reports that Cade Horton is being called up to address some of the starting pitching woes after the Cubs lost Shōta Imanaga to a mild hamstring strain, so that addresses one area of need. However, the third base situation is still a collection of replacement level utility men in search of a long term solution.
It’s pretty clear that the Cubs have a third base production problem when you look at the FanGraphs leaderboard of fWAR at third so far this season:
Third base production by fWAR by team
Team
G
PA
HR
R
RBI
SB
BB%
K%
ISO
BABIP
AVG
OBP
SLG
wOBA
wRC+
BsR
Off
Def
WAR
Team
G
PA
HR
R
RBI
SB
BB%
K%
ISO
BABIP
AVG
OBP
SLG
wOBA
wRC+
BsR
Off
Def
WAR
BOS
40
176
9
29
30
1
8.52%
18.18%
.276
.353
.321
.392
.596
.424
173
-0.5
13.9
-0.1
2.1
KCR
43
164
3
12
20
8
8.54%
15.85%
.156
.361
.313
.374
.469
.371
137
0.4
7.4
1.8
1.5
ATL
37
164
8
17
25
1
4.88%
29.88%
.201
.371
.286
.329
.487
.355
125
-0.1
4.7
3.7
1.4
SFG
39
162
7
21
23
5
17.90%
25.93%
.197
.265
.220
.364
.417
.353
126
0.2
5.3
2.1
1.3
STL
39
164
4
19
18
1
10.98%
9.76%
.146
.272
.264
.348
.410
.332
112
-0.1
2.1
5.1
1.3
HOU
37
156
4
15
17
0
13.46%
17.31%
.128
.294
.256
.365
.383
.341
122
-0.4
3.5
2.6
1.2
SDP
37
151
3
23
16
7
9.27%
17.88%
.156
.358
.304
.371
.459
.364
136
0.7
7.1
-2.2
1.0
TEX
39
144
4
14
12
5
7.64%
21.53%
.159
.306
.258
.313
.417
.319
106
-0.1
0.8
2.5
0.9
TBR
42
159
7
17
17
3
5.03%
20.13%
.203
.277
.257
.289
.459
.323
112
-0.5
1.6
-0.6
0.7
CLE
43
155
7
15
22
8
7.10%
14.84%
.190
.268
.270
.323
.460
.334
117
0.5
3.5
-3.4
0.6
PIT
38
154
1
8
14
3
5.19%
19.48%
.076
.310
.250
.299
.326
.282
74
-0.1
-4.8
4.9
0.5
DET
47
153
2
17
21
3
9.15%
19.61%
.074
.257
.213
.294
.287
.269
71
0.3
-4.7
4.7
0.5
SEA
42
148
5
21
21
3
6.76%
21.62%
.139
.340
.285
.333
.423
.336
124
-1.7
2.3
-2.9
0.5
CHW
39
152
2
13
13
1
11.84%
21.05%
.098
.265
.212
.316
.311
.290
85
-0.1
-2.8
2.0
0.5
CIN
43
165
4
14
25
4
7.88%
17.58%
.126
.286
.252
.309
.377
.306
87
-0.7
-3.4
2.2
0.4
COL
38
153
4
13
9
1
14.38%
32.68%
.147
.263
.186
.307
.333
.294
72
-0.1
-5.2
3.5
0.4
ARI
38
156
10
21
23
1
8.97%
28.21%
.263
.190
.190
.282
.453
.319
100
0.0
0.0
-2.4
0.3
BAL
37
138
2
6
11
0
6.52%
24.64%
.079
.283
.222
.275
.302
.261
67
-0.3
-5.4
3.0
0.2
NYM
40
162
4
16
14
1
10.49%
20.37%
.140
.252
.217
.298
.357
.294
88
-0.1
-2.3
-0.9
0.2
WSN
43
149
1
12
15
1
4.03%
26.85%
.113
.327
.239
.275
.352
.278
75
-0.4
-4.9
1.6
0.2
TOR
43
140
0
9
6
2
6.43%
19.29%
.039
.267
.213
.268
.252
.240
51
-0.3
-8.1
3.7
0.0
MIA
41
142
1
14
9
3
5.63%
31.69%
.085
.306
.208
.262
.292
.248
51
0.4
-7.9
3.2
0.0
ATH
44
141
0
6
18
0
5.67%
14.18%
.117
.273
.234
.275
.352
.275
75
-0.2
-4.2
-1.1
-0.1
LAD
39
150
1
9
8
1
12.67%
29.33%
.094
.301
.205
.315
.299
.286
80
-0.1
-3.7
-2.8
-0.2
NYY
38
137
1
18
9
0
9.49%
23.36%
.058
.284
.215
.301
.273
.269
70
-0.7
-5.4
-0.8
-0.2
PHI
37
155
1
15
13
1
2.58%
18.06%
.068
.286
.238
.271
.306
.259
61
-0.1
-7.2
-1.3
-0.3
LAA
38
138
3
11
15
1
5.80%
21.01%
.109
.258
.219
.268
.328
.267
68
-0.4
-5.6
-2.9
-0.4
MIN
42
145
3
10
12
1
4.14%
20.69%
.081
.260
.221
.262
.301
.254
61
-0.5
-7.0
-2.7
-0.5
CHC
46
145
0
18
6
3
11.72%
26.21%
.031
.278
.195
.290
.227
.247
56
-0.1
-7.7
-3.1
-0.6
MIL
41
140
2
13
18
3
2.86%
17.14%
.088
.188
.168
.221
.256
.217
33
0.0
-11.1
-1.5
-0.8
Select offensive stats heading into games on May 9
FanGraphs
I’m sure more than a few of you are staring at Boston at the top of this leaderboard and internally groaning as you recall that the Cubs just missed on signing Alex Bregman last offeseason. In fact, a close read of that reporting from The Athletic indicates that the Cubs former President of Baseball Operations, Theo Epstein, was instrumental in crafting the deal that landed Bregman.
There’s a 2.7 fWAR gap between the Cubs production at third base so far this year and the Red Sox. And it’s fairly bleak across the board. The Cubs are one of three teams with zero home runs out of their third baseman. The three stolen bases are nice but fairly middling as production goes. The .195/.290/.227 slashline is flat out abysmal, as is the wRC+ of 56 — fully 44 percent below league-adjusted average. I guess on that front at least we can celebrate being a full 23 percent better than the Brewers league-worst wRC+ of 33,
A glance at the Cubs who have logged at least 10 plate appearances at third base so far this season is illustrative of the problem:
Cubs 3B production heading into May 9
Name
G
PA
HR
R
RBI
SB
BB%
K%
ISO
BABIP
AVG
OBP
SLG
wOBA
wRC+
BsR
Off
Def
WAR
Name
G
PA
HR
R
RBI
SB
BB%
K%
ISO
BABIP
AVG
OBP
SLG
wOBA
wRC+
BsR
Off
Def
WAR
Jon Berti
15
44
0
6
2
2
9.09%
22.73%
.050
.367
.275
.341
.325
.305
95
-0.1
-0.4
-1.1
0.0
Matt Shaw
18
67
0
10
2
0
14.93%
26.87%
.018
.231
.158
.284
.175
.230
45
-0.1
-4.5
-1.5
-0.4
Nicky Lopez
4
11
0
2
1
0
18.18%
18.18%
.000
.143
.111
.273
.111
.208
30
0.0
-0.9
0.6
0.0
Gage Workman
5
13
0
0
0
1
7.69%
46.15%
.000
.333
.167
.231
.167
.191
19
0.2
-1.1
-1.2
-0.2
Select offensive stats
FanGraphs
Utility men Jon Berti and Nicky Lopez appear to be in something like a platoon here, although it’s not based in the handedness of the pitcher just yet. It’s worth noting Vidal Bruján hasn’t even amassed 10 plate appearances as a third baseman yet, so he doesn’t appear in this table.
Berti has been the most productive option the Cubs have at the hot corner by far to date in 2025. Admittedly, most productive really just indicates he’s very close to league average by wRC+ and not actually a negative in terms of fWAR.
The Cubs must be hoping Matt Shaw can turn a corner and be their longer term solution after some work in Triple-A, but it’s been a mixed bag for Shaw so far in Iowa. While he’s been a positive producer with a wRC+ of 106 the slash line of .246/.387/.361 is a mixed bag. He’s barely striking out at Triple-A with a K rate of 12 percent, but it hasn’t really translated into more barrels or power production. His launch angle in Triple-A has collapsed to 5.8 degrees.
So who should man third base as the Cubs head into a tough series against the Mets?
Poll
Who should play third base for the Cubs?
0%
Recall Matt Shaw
(0 votes)
0%
Other — Comment
(0 votes)
0 votes total