
Major League Baseball capped a frenzied Wild Card round with a reprise of one of the sport’s biggest rivalries, and while it’ll be some time before the official TV ratings for the Red Sox-Yankees finale land, everything leading up to Thursday night’s game suggests we’re in for a seismic postseason.
According to Nielsen’s new Big Data + Panel figures, Game 1 of the Sox-Yanks scrap averaged 6.52 million viewers on ESPN, marking the biggest TV turnout for a Wild Card game since the best-of-three format was rolled out in 2022. Boston’s 3-1 win in the Bronx, which peaked at 9.9 million viewers, eclipsed the previous high-water mark (4.02 million for Game 3 of last year’s Mets-Brewers series) by 62%.
The deliveries for the subsequent pair of games are expected to be greater still, although it’s worth noting that Thursday night’s rubber match went head-to-head with 49ers-Rams on Amazon’s Prime Video.
If an October meeting between the Red Sox and Yankees will always scare up a crowd—their most recent playoff showdown, a one-and-done Wild Card outing in 2021, averaged 7.69 million viewers on ESPN/ESPN2—the Game 1 figures are in keeping with MLB’s strong showing over the last six months. Regular-season viewing was up for each of the league’s national partners, with ESPN’s Sunday Night Baseball improving 21% with an average draw of 1.83 million per game, while Fox’s audience grew 9% year-over-year to 2.04 million. TBS/truTV and FS1 also attracted more fans in 2025, as the WBD cable nets were up 29% to 462,000 viewers per game, while Fox’s corporate sibling saw a 10% lift (324,000).
National ad sales revenues at the four outlets came in at $358 million on the season, per EDO Ad EnGage estimates.
And while the money (and TV impressions) kept rolling right in, the hunger for on-site experiences didn’t show any sign of lagging. MLB attendance grew for the third straight year, as some 71.4 million ducats were sold in 2025—up a hair from 71.3 million in 2024. The last time the league enjoyed a three-year stretch of gains at the ballpark was between 2005 and 2007. Meanwhile, ticket buyers are getting younger, as the average age of a single-game buyer dropped to 43 years, down from 46 in 2023.
The aforementioned gains coincided with the third year under the unblinking eye of baseball’s pitching clock. During the regular season, the average duration of an MLB game came in at 2 hours and 38 minutes, up a negligible two ticks from last year (2:36), but down from 2023’s 2:40 pace. As recently as 2021, the average amount of time it took for an MLB game to play out was a leaden 3 hours and 30 minutes. All things being equal, the pitch clock may well prove to be Rob Manfred’s greatest legacy.
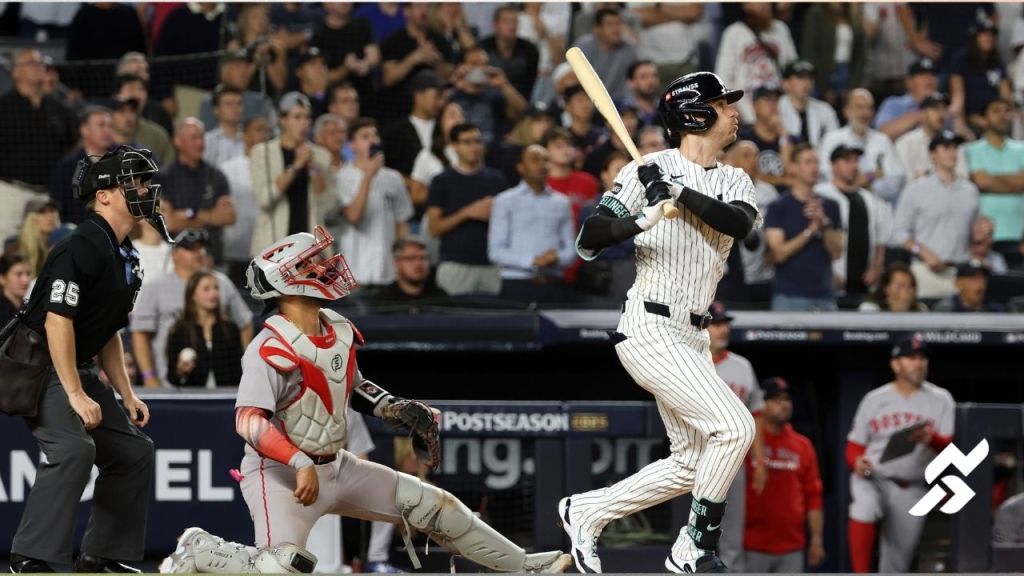
With the Yankees having eliminated Boston on a star-making performance from hurler Cam Schlittler—the 24-year-old fanned 12 batters and issued zero free passes to first over an eight-inning stretch—MLB enters the Divisional round with a murderer’s row of top media markets in play. New York and Los Angeles alone have bragging rights to a combined 13.7 million TV households, accounting for 10.7% of the national base. Also in the mix are the Cubs, repping the No. 3 Chicagoland market (3.75 million TV homes); the Phillies (No. 5 with 3.17 million); the Mariners (No. 13, 2.15 million) and the Tigers (No. 14, 1.97 million). The Brewers rep the smallest media market in play, as No. 39 Milwaukee is home to 957,240 TV households, while Toronto, for obvious reasons, has no representation in the States.
MLB’s media partners will look to take full advantage of all those TV sets on Saturday, when the NLDS kicks off with Cubs-Brewers on TBS at 2 p.m. ET. Fox gets Yanks-Jays in the lead-out, and then it’s back to cable for Game 1 of Dodgers-Phillies at 6:30 p.m. ET. FS1 closes out the first day of Divisional action with Tigers-Mariners in primetime.
Of course, the ratings are only part of the story. By the time the World Series gets underway on Oct. 24, MLB is expected to have made an official announcement regarding its new three-year media package.