
After 50 games last season the Milwaukee Brewers were sitting atop the National League Central Division with a 32-18 record. This season they are 24-26 and in fourth place, in large part because of their struggles on offense. The Brewers have been shut out six times already, including five times in May – they were shut out nine times in all of 2024.
Here is a look at several Brewers offensive statistics through 50 games in the 2024 season compared to this season.
Advertisement
Advertisement
Advertisement
Runs scored
2024: 251
2025: 212
Hits
2024: 438
2025: 377
Home runs
2024: 60
2025: 41

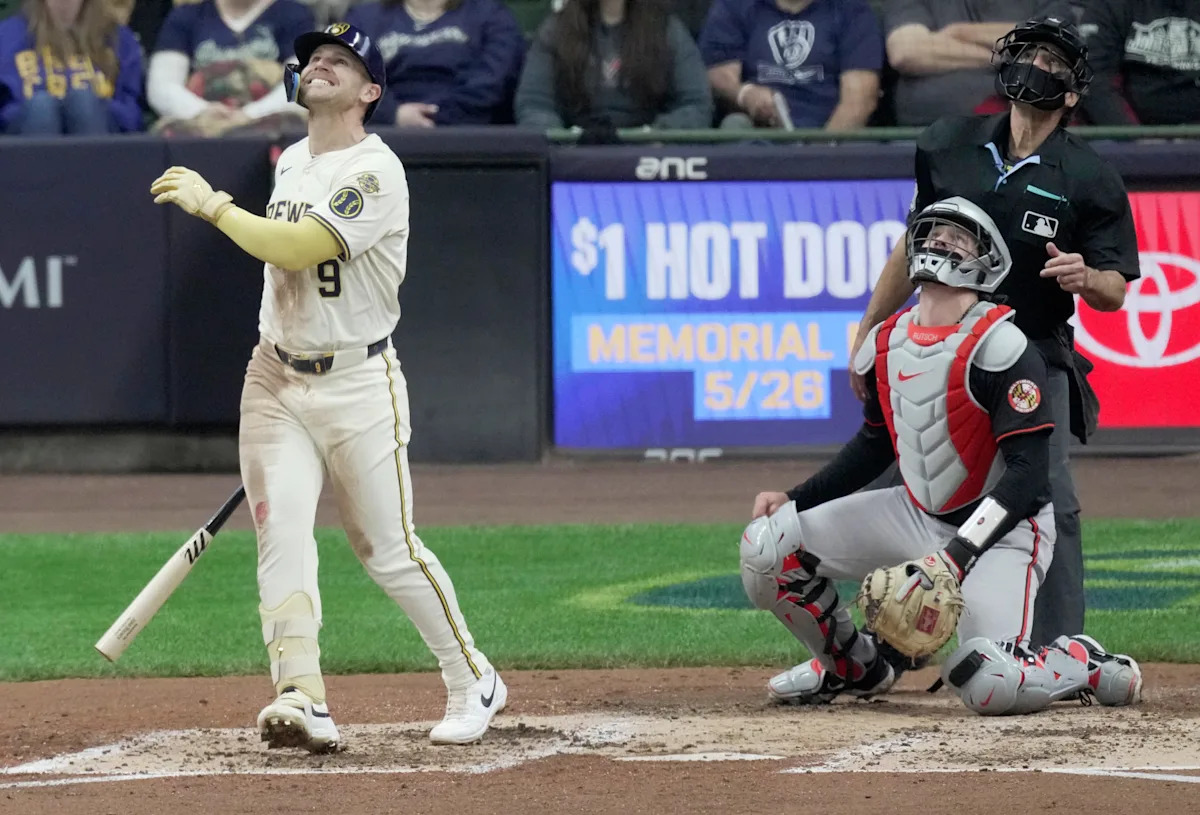
The Brewers’ Jake Bauers grimaces after hitting a fly ball that stranded a runner on base in the fourth inning of their game against the Orioles on May 21.
Runs batted in
2024: 239
2025: 192
Walks
2024: 186
2025: 172
Strikeouts
2024: 446
2025: 407
Stolen bases
2024: 67
2025: 65
Batting average
2024: .255
2025: .229
On-base percentage
2024: .332
2025: .308
Slugging percentage
2024: .419
2025: .349
On-base plus slugging percentage
2024: .751
2025: .657
This article originally appeared on Milwaukee Journal Sentinel: How do the Brewers’ offensive stats compare to 2024 after 50 games?