
One of the big priorities for Kansas City Royals President of Baseball Operations JJ Picollo was to improve the lineup in 2026. While the team hit better after the All-Star Break, their struggles out of the gate ultimately cost them a postseason berth in 2025, despite making the ALDS in 2024.
Last year, the Royals ranked 26th in runs scored and home runs, and 22nd in OBP and wRC+, according to Fangraphs. They also had the 12th-highest O-Swing% and the highest pop-up percentage in baseball. Thus, a priority for the Royals this year was to focus on improving pitch recognition and swing decisions so they would chase and pop up less in 2026.
In addition to hiring new assistant hitting coaches Connor Dawson and Marcus Thames, the Royals also acquired outfielders Isaac Collins, Lane Thomas, and Starling Marte to help give the Royals veteran at-bats that they were sorely missing last year, especially from the outfield position. Last season, the Royals outfielders had the highest pop-up percentage and the lowest wRC+ among Major League outfielders, according to Fangraphs.
Despite the changes, it’s been a similar story through four games this season.
While it’s an extremely small sample, the numbers have been concerning nonetheless. The Royals are tied for 28th in runs scored, 27th in wRC+, and 26th in batting average. Even though they are 2-2, they have a -5 run differential, despite only allowing 14 runs, which is tied for the fewest in the American League Central.
How much should Royals fans worry about this offense, especially with how slow they got out of the gate in 2025? I will talk about three metrics from this Kansas City offense so far and what those numbers could say about their outlook in the near future.
27.3% O-Swing%
Last year, the Royals had the 12th-highest O-Swing% in baseball at 32%. That put them ahead of teams like the Athletics (31.9%), the Tigers (31.3%), and the White Sox (31.3%). Kansas City wanted to lower this in 2026 in order to not just draw more walks (7.2% BB%, 29th in baseball), but improve their OBP as well (.309, 22nd in baseball).
So far, the early results have been good for chasing out of the zone.
The Royals, through five games, have a 27.3% O-Swing%, which is the second-lowest O-Swing% in baseball, according to Fangraphs. It is also a 4.7% improvement from a year ago, which is major progress. The Royals’ walk rate is also up slightly at 8.0%, which is 0.8% higher than their BB% last season. The OBP is lower at .261, but their low BABIP could be the cause. Their .220 BABIP is the second-lowest in baseball.
When it comes to how Royals individually have done, this is how they rank in plate discipline data, as organized by O-Swing%.
The Royals have two hitters (Maikel Garcia and Collins) with O-Swing% under 20%, and seven hitters in total with O-Swing% under 30%. In terms of contact rate, they have eight hitters with rates over 80%.
The only real hitter that’s an established player with a higher-than-wanted chase rate is Bobby Witt Jr. Through five games, he has a 37.1% O-Swing%. Last year, he had a 34.5% O-Swing%, so it seems like Witt is a little overeager to start the season. Despite his high chase rate, he still has an 81.8% contact rate, which shows his strong ability to put the bat on the ball, despite the questionable plate decisions thus far.
One hitter who has made positive gains is Vinnie Pasquantino, who has a 20% chase rate. Last year, he had a 32.9% chase rate, so he has seen a 12.9% improvement in O-Swing%. As a result, his contact rate is 87.5%, which is 4.1% higher than last year. That kind of progress is important for Pasquantino, especially with him hitting in the No. 3 hole in the Royals’ lineup.
31.6% Hard-Hit Rate
In 2025, Kansas City hitters produced a 40.7% hard-hit rate. That ranked 14th in baseball, just behind the Detroit Tigers (40.8%), but ahead of playoff teams like the Cubs (40%) and the Brewers (39.2%). Thus, it was expected that with a decline in chasing, the Royals’ offense could see major gains in 2026, especially considering their ability to hit the ball hard last year.
Unfortunately, while the chase rate has improved in 2026, the hard-hit rate has trended in the opposite direction. Through five games, the Royals have a 31.6% hard-hit rate, the lowest mark in baseball.
The Royals aren’t as bad in other Statcast categories.
They rank 24th in average exit velocity (87.9 MPH) and barrel rate (6.3%), and 26th in xwOBA (.288). It’s not good, but they are not as brutal as Kansas City’s hard-hit ranking. It’s hard to get optimistic about an offense when they are sitting at the bottom of a very important Statcast category.
Individually, this is how Royals hitters have fared this season in those four Statcast categories I discussed above.
Jensen leads the Royals in hard-hit rate and average exit velocity with 57.1% and 94.7 MPH marks, respectively. He hasn’t launched the ball well, which explains why his xwOBA is only .229. That said, the fact that he’s hitting the ball as hard as he is shows that he has the batted-ball skills to succeed at the Major League level this season and beyond.
Witt has been a hitter who has a great hard-hit rate (38.5%), but it hasn’t translated into results just yet (.270 wOBA). However, his .388 xwOBA leads the team and is 118 points higher than his actual wOBA. Thus, he could be due for a hot streak soon, especially as he gets more comfortable in the box during this homestand against Minnesota and Milwaukee.
Two hitters that have struggled in hard-hit rate but should improve are Pasquantino and Jac Caglianone. Pasquantino has an 18.2% hard-hit rate while Caglianone has a 16.7% rate. Those rank 9th and 10th among Royals hitters this season, respectively. The good thing is that Vinnie and Cags have improved greatly in swing decisions so far this year, so their lackluster hard-hit rate may be due to them temporarily trading better plate discipline for power.
That makes sense at this time of the year, especially for hitters like Vinnie and Cags who need to get settled in. It would not be surprising to see them see ticks up in their hard-hit rate and barrels soon, especially since they have zero barrels between the two of them through four games. Safe to say that won’t stay zero for long.
13% IFFB% (Pop-Up Rate)
The Royals had major pop-up issues in 2025, as illustrated by their 11.9% IFFB%, which led the league.
Typically, pop-ups occur when a hitter is pressing or trying too hard at the plate with their swing. It seemed like that was the case last year, and the Royals are trying to curb that pressing this year by being more intentional about communicating their team philosophy throughout, as evidenced by Anne Rogers’ Opening Day tweet revealing some important Royals locker room signage.
The Royals are hoping that a more consistent and focused approach can not just lead to more walks and fewer chases, but also to fewer pop-ups, which are killers because they turn so easily into outs.
Kansas City doesn’t lead the league in IFFB%, ranking 7th this year, according to Fangraphs. That said, their 13% IFFB% is 1.1% higher than last year, which isn’t exactly a positive trend in this crucial category.
In terms of Royals leaders in IFFB%, below are the Top-4, with not only their IFFB% this year but also their mark a season ago in parentheses.
Nick Loftin, 100% (12.5% in 2025)
Witt, 28.6% (10.6% in 2025)
Perez, 25% (8.8% in 2025)
Jonathan India, 20% (15.4% in 2025)
Loftin and India are the usual suspects. They both had double-digit IFFB% and ranked 5th and 7th in IFFB%, respectively, among Royals hitters with 100 or more plate appearances last season.
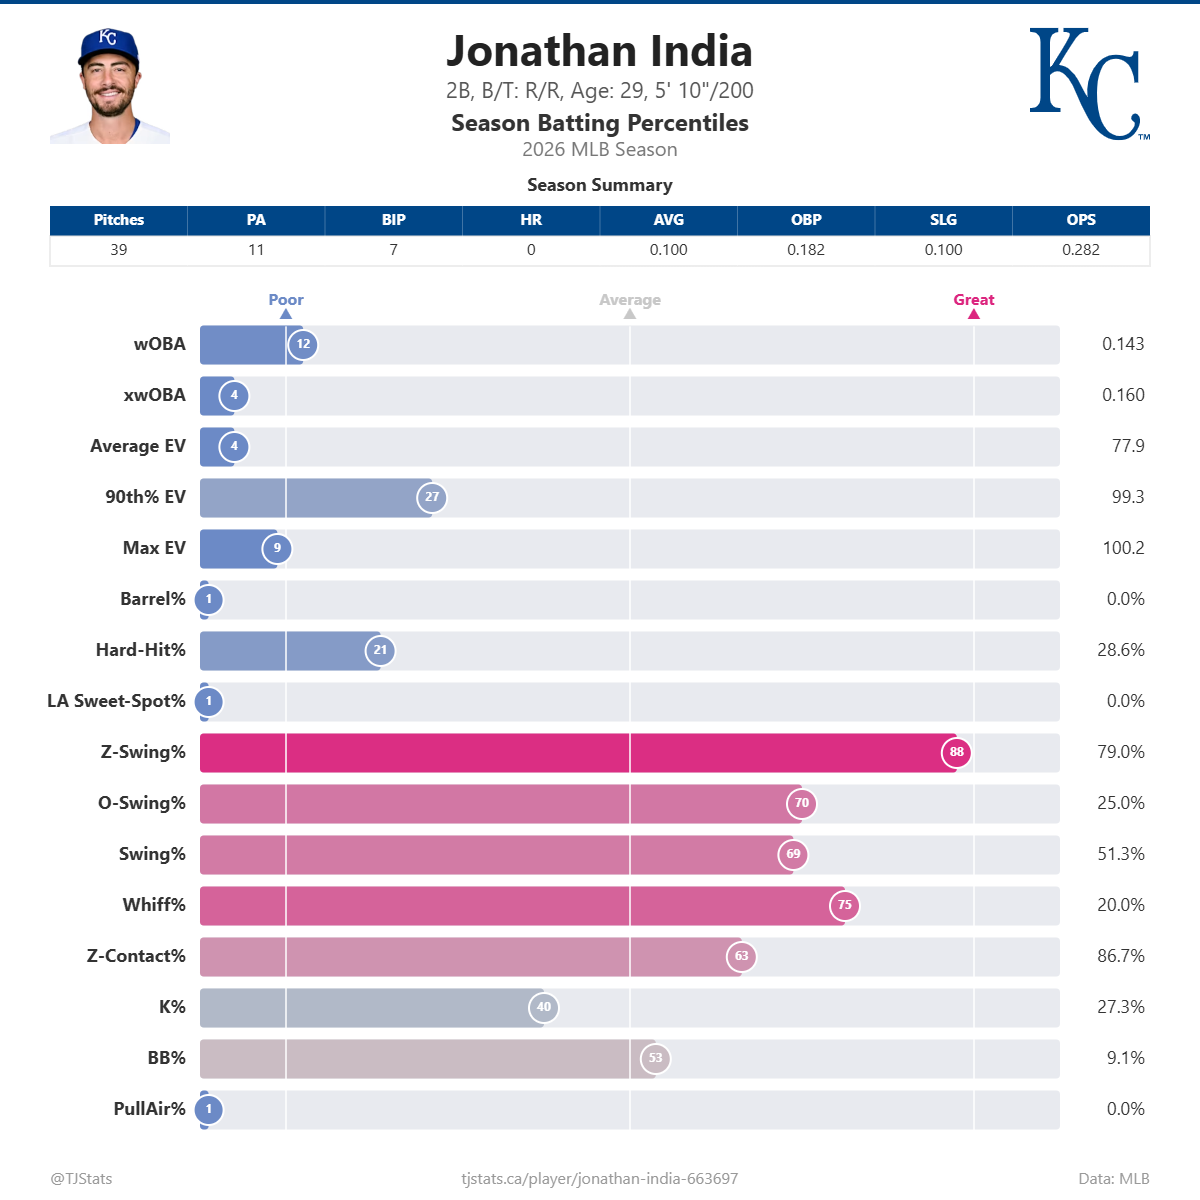
India is the more concerning of the pair, especially since his 15.4% IFFB% last year was a career high, and he produced the worst offensive season of his career (89 wRC+). In addition to a high IFFB% in 2026, India’s hard-hit rate is low at 28.6%, and his K% is high at 27.3%, nearly 9 percentage points higher than his K% in 2025.
Looking at his Statcast percentiles via TJ Stats, he shows his trademark plate discipline, as illustrated by stellar whiff and O-Swing% numbers. However, his exit velocity, barrel, LA Sweet-Spot%, and hard-hit rate percentiles have been paltry.
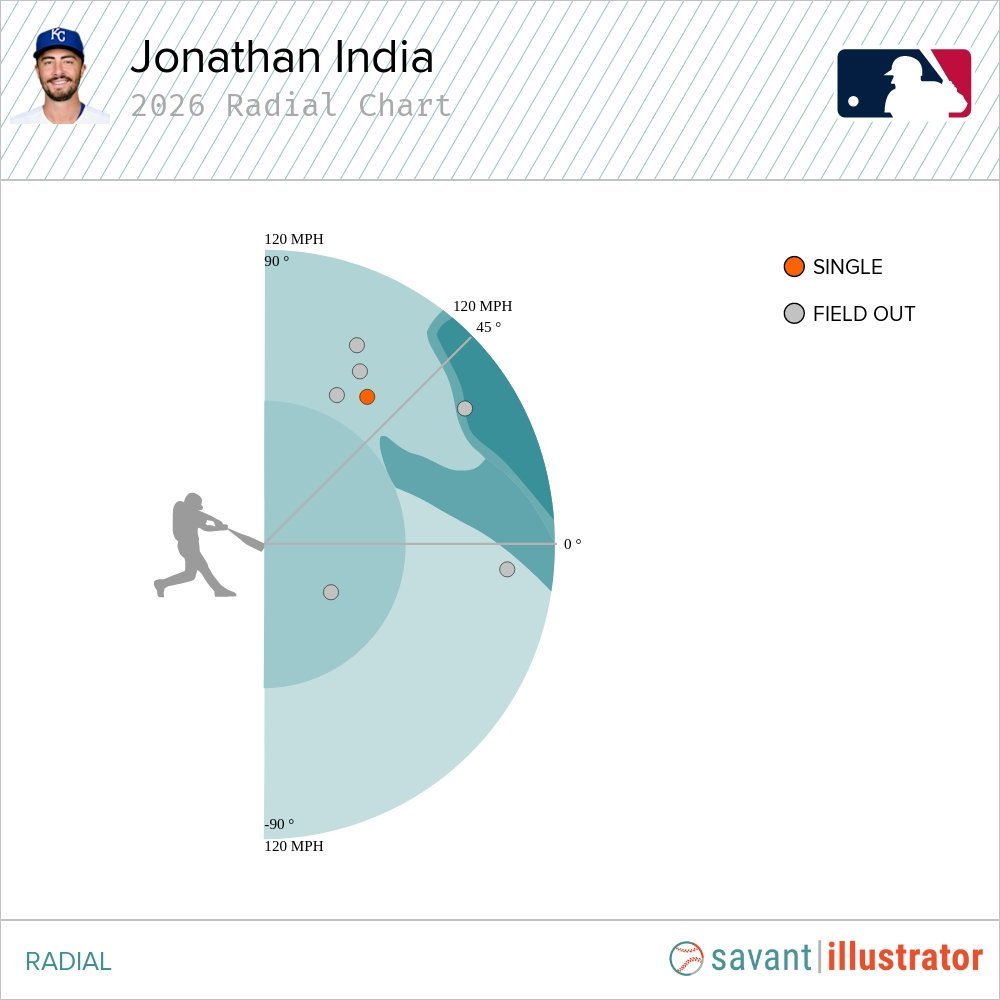
For India to be a valuable offensive player, he needs to cut down on pop-ups and increase barrels. In order to do that, he needs to be better in terms of increasing that LA Sweet-Spot%. His radial chart on batted balls in play shows that he’s getting way too under baseball, much to his and the Royals’ detriment.
India is only the surface level of this IFFB% problem. Bobby needs to be better, as his IFFB% is 18% higher than his mark in 2025. The same is true with Salvy, whose 25% mark is 16.2% higher than his IFFB% last season. It’s not good when two of the Royals’ top-four hitters are in the 25+ percentage mark in IFFB%.
Regression should positively favor Witt and Salvy as they get more at-bats. They have a proven track record of correcting this issue.
As for India, I am not so sure. That said, he has plenty of time to show that these early IFFB% issues are also a flash in the pan and will be corrected soon.