
With a “must lose” game on the schedule, the Washington Wizards took the court against the Chicago Bulls with only eight players available, the oldest and most experienced of whom was 23-year-old Justin Champagnie.
Champagnie entered the game with just 1,813 career minutes spread over four seasons — with 1,263 coming this season. He was on a two-way contract until about a month ago.
Washington’s starting lineup consisted of:
Bub Carrington — 19 years old
AJ Johnson — 20 years old
Alex Sarr — 19 years old
Justin Champagnie — 23 years old
Kyshawn George — 21 years old
By the way, Champagnie was the oldest player available for the Wizards last night — their bench consisted of Colby Jones (22), JT Thor (22), and Tristan Vukcevic (22). For those not keeping score at home, Washington’s average age against the Bulls was 21-years-old.
The Bulls — who began the night with an outside chance of moving from ninth to eighth in the Eastern Conference standings — deployed a more veteran lineup that included Nikola Vucevic, Coby White, and Kevin Huerter. As would be expected, Chicago rolled to a comfortable 30-point victory, even though the outcome became meaningless before the final buzzer.
The Eastern Conference playoffs picture is locked. Chicago face the Miami Heat in the 9-10 play-in game, the winner of which will face the loser of the Orlando Magic vs. Atlanta Hawks 7-8 contest.
Bright Spots and Observations
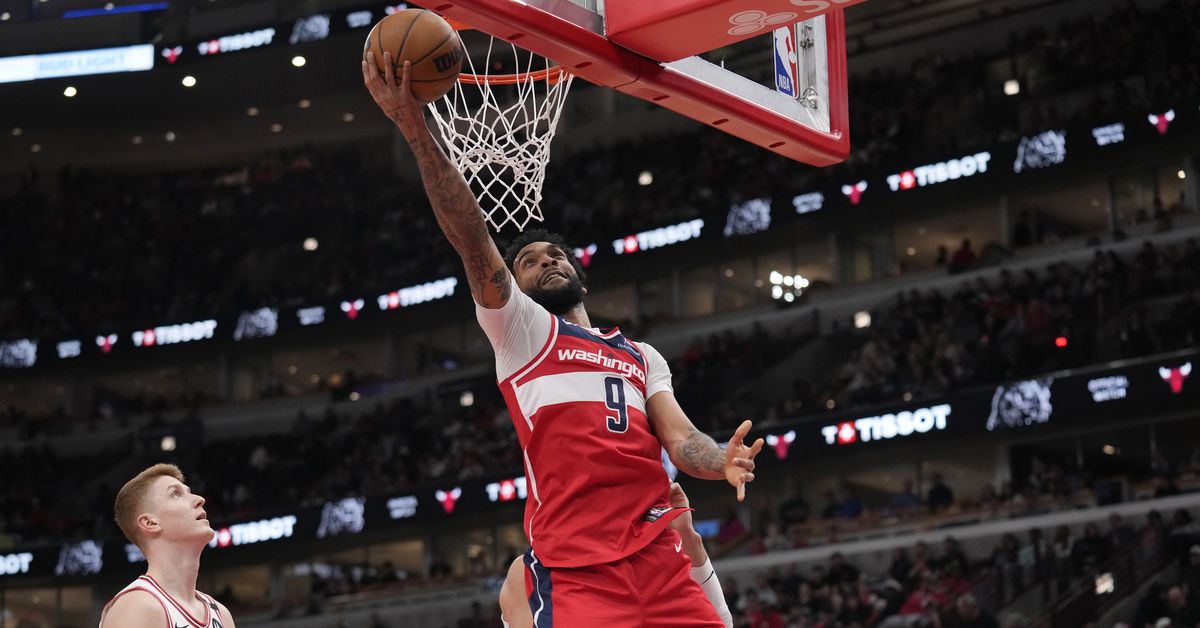
Justin Champagnie played another good game — 22 points on 15 shots, 14 rebounds, 3 steals. He committed three turnovers, which dragged down his overall offensive efficiency, but it was still a good night overall.
Bub Carrington was decent — 18 points, 5 rebounds, 11 assists. His shooting was okay (7-15 from the floor; 2-6 from three), but four turnovers pushed his offensive rating to a subpar 106 (-8.6 relative to league average).
Tristan Vukcevic made a few shots, which was nice. His defense and rebounding was largely absent — just 3 boards in 26 minutes for the big man.
Kyshawn George was okay in his 24 minutes. He was the only Wizards player with an offensive rating (points produced per possession x 100) above league average. He left the game early after turning his ankle.
Washington’s 88 offensive rating was their fourth worst offensive performance of the season.
The Wizards are now guaranteed one of the two worst records in the league.
Chicago won by 30 despite shooting just 31.7% from three.
For some reason, we watched the Monumental broadcast on Playback last night. It was as bad as I remembered. For anyone who might be wondering, yes Drew Gooden’s “stat” that Vukcevic entered the night scoring 1.3 points ever two minutes this season was bizarre and meaningless.
The Wizards close out their season Sunday afternoon against the Miami Heat.
Four Factors
Below are the four factors that decide wins and losses in basketball — shooting (efg), rebounding (offensive rebounds), ball handling (turnovers), fouling (free throws made).
The four factors are measured by:
eFG% (effective field goal percentage, which accounts for the three-point shot)
OREB% (offensive rebound percentage)
TOV% (turnover percentage — turnovers divided by possessions)
FTM/FGA (free throws made divided by field goal attempts)
In the table below are the four factors using the percentages and rates traditionally presented. There’s also a column showing league average in each of the categories to give a sense of each team’s performance relative to the rest of the league this season.
Four Factors: Wizards at Bulls
FOUR FACTORS
WIZARDS
BULLS
LGAVG
FOUR FACTORS
WIZARDS
BULLS
LGAVG
eFG%
44.0%
53.2%
54.3%
OREB%
16.3%
28.3%
25.2%
TOV%
15.8%
11.8%
12.7%
FTM/FGA
0.099
0.215
0.190
PACE
101
98.8
ORTG
88
117
114.6
Stats & Metrics
Below are a few performance metrics. PPA is my overall production metric, which credits players for things they do that help a team win (scoring, rebounding, playmaking, defending) and dings them for things that hurt (missed shots, turnovers, bad defense, fouls).
PPA is a per possession metric designed for larger data sets. In small sample sizes, the numbers can get weird. In PPA, 100 is average, higher is better and replacement level is 45. For a single game, replacement level isn’t much use, and I reiterate the caution about small samples sometimes producing weird results.
POSS is the number of possessions each player was on the floor in this game.
ORTG = offensive rating, which is points produced per individual possessions x 100. League average last season was 114.8. Points produced is not the same as points scored. It includes the value of assists and offensive rebounds, as well as sharing credit when receiving an assist.
USG = offensive usage rate. Average is 20%.
ORTG and USG are versions of stats created by former Wizards assistant coach Dean Oliver and modified by me. ORTG is an efficiency measure that accounts for the value of shooting, offensive rebounds, assists and turnovers. USG includes shooting from the floor and free throw line, offensive rebounds, assists and turnovers.
+PTS = “Plus Points” is a measure of the points gained or lost by each player based on their efficiency in this game compared to league average efficiency on the same number of possessions. A player with an offensive rating (points produced per possession x 100) of 100 who uses 20 possessions would produce 20 points. If the league average efficiency is 114, the league — on average — would produced 22.8 points in the same 20 possessions. So, the player in this hypothetical would have a +PTS score of -2.8.
Players are sorted by total production in the game.
Stats & Metrics: Wizards
WIZARDS
MIN
POSS
ORTG
USG
+PTS
PPA
+/-
WIZARDS
MIN
POSS
ORTG
USG
+PTS
PPA
+/-
Justin Champagnie
38
81
114
20.6%
-0.1
171
-18
Bub Carrington
35
74
106
26.3%
-1.8
125
-18
Tristan Vukcevic
26
55
113
25.1%
-0.2
112
-16
Kyshawn George
24
51
118
16.6%
0.3
100
-21
Colby Jones
32
68
83
10.9%
-2.3
42
-14
JT Thor
24
51
59
10.3%
-3.0
-25
-10
Alex Sarr
26
55
45
27.9%
-10.7
-105
-19
AJ Johnson
34
72
53
20.3%
-9.0
-88
-34
Stats & Metrics: Bulls
BULLS
MIN
POSS
ORTG
USG
+PTS
PPA
+/-
BULLS
MIN
POSS
ORTG
USG
+PTS
PPA
+/-
Julian Phillips
28
59
178
19.8%
7.4
395
25
Nikola Vucevic
28
60
119
24.7%
0.6
264
23
Matas Buzelis
32
67
126
22.6%
1.7
216
12
Coby White
28
59
122
21.3%
1.0
230
30
Zach Collins
20
42
107
21.0%
-0.7
131
7
Jahmir Young
3
6
285
17.0%
1.7
884
4
Kevin Huerter
31
65
86
15.5%
-2.9
66
12
Talen Horton-Tucker
24
51
97
25.4%
-2.3
42
1
Jalen Smith
4
9
197
8.3%
0.6
208
6
Jevon Carter
13
28
85
27.0%
-2.3
62
15
Patrick Williams
23
50
86
11.4%
-1.6
15
7
Emanuel Miller
3
6
0.0%
0.0
0
4
E.J. Liddell
3
6
0.0%
0.0
0
4