
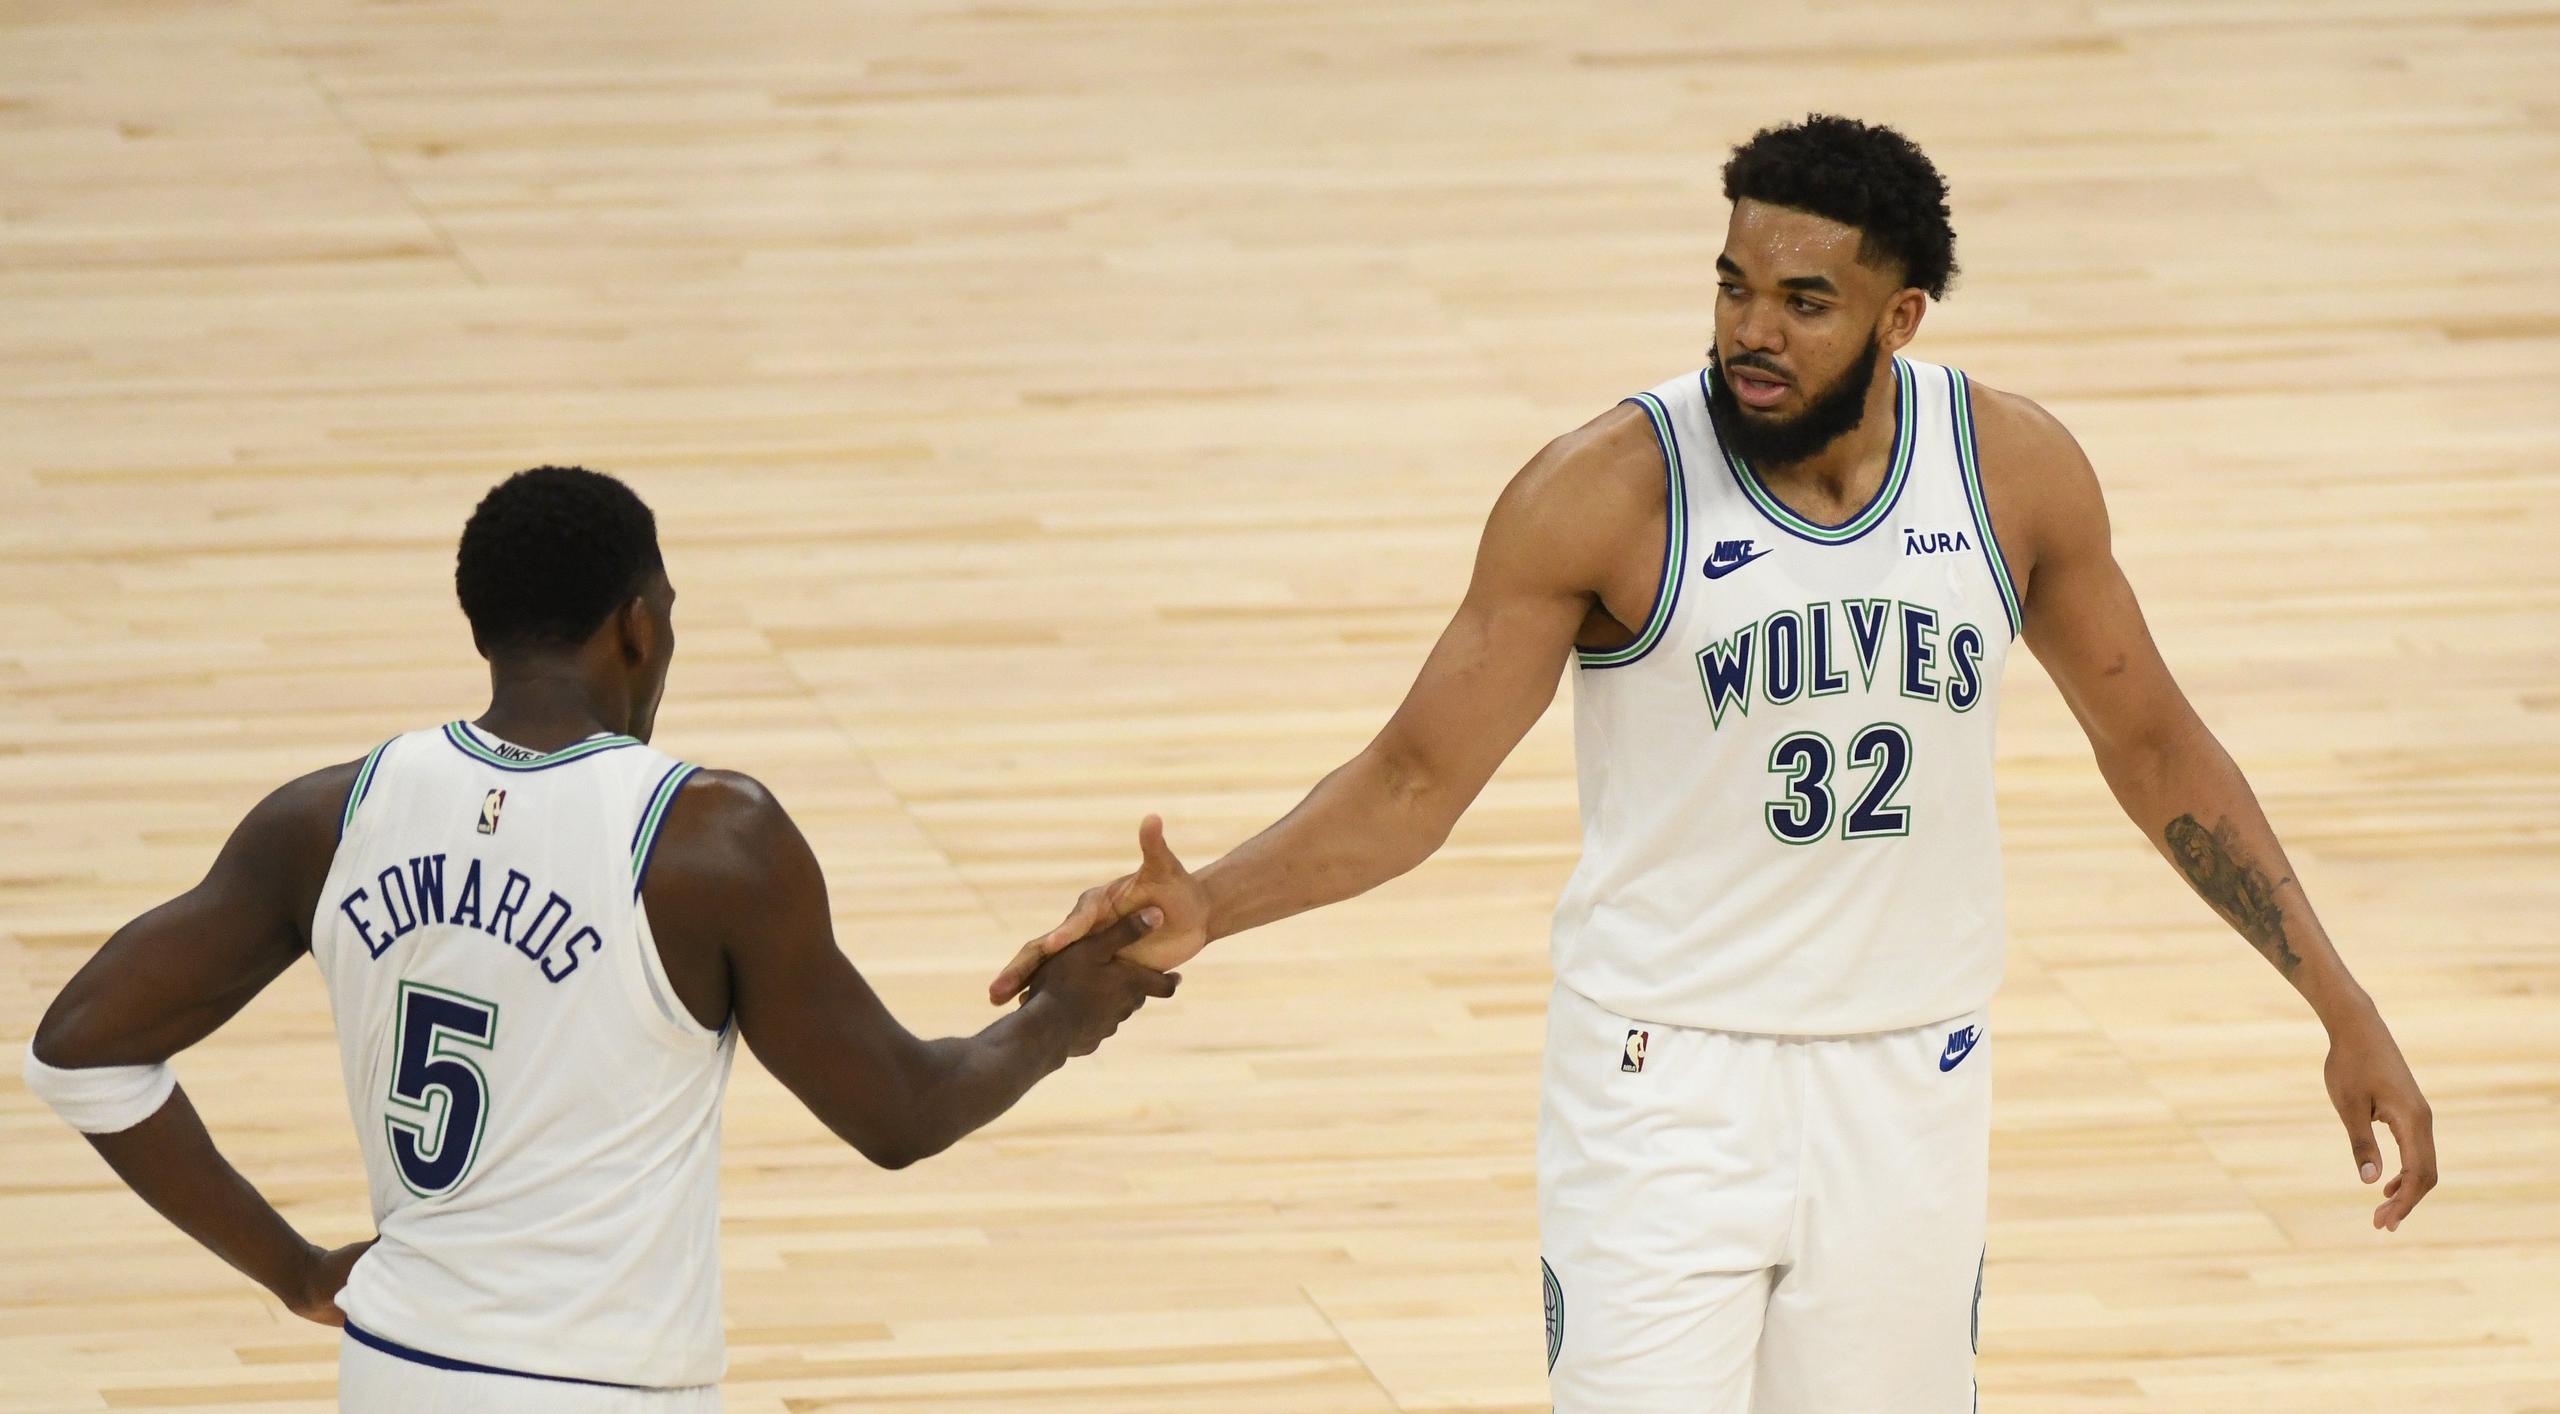
Anthony Edwards and Karl-Anthony Towns both turned into stars for the Timberwolves after getting drafted (Photo by Stephen Maturen/Getty Images)
The NBA Draft is where franchises find their future stars. Under the salary cap, first-round picks are precious: hit on a pick and you get a cornerstone on a cheap rookie deal; miss and your team may be left scrambling to fill the void. We examined every first-round pick from 2014–2020 to see which teams drafted best. All player stats were compiled through the 2023–24 season. Players like Joel Embiid (2023 MVP, ~10,500 points), Luka Dončić (4× All-NBA, averaging nearly 28 points, 8 rebounds, 8 assists), Jayson Tatum (~10,200 points by age 25) and Devin Booker (~12,000 points) set the high bar for this era’s first-rounders.
How We Scored Teams
For each team’s 2014–2020 first-round picks, we measured five areas and combined them into an overall “Success Score” (0–100 scale):
Production – Scoring and basic stats (e.g. points per game) of the picks.Advanced impact – Advanced metrics like Win Shares, BPM, VORP, etc., to capture a player’s on-court impact beyond the box score.Availability – How much the picks actually played (e.g. games played), indicating durability and longevity.Awards – Major individual accolades (All-Star selections, Rookie of the Year, MVP, Defensive Player of the Year, etc.) earned by the picks.Team success – Whether the picks contributed to team success (for example, played in the postseason or won championships).
We converted each metric into a percentile (relative to all first-rounders in the sample) and weighted them 39% Production, 22% Advanced, 17% Availability, 6% Awards, 16% Team Success. The weighted sum is each player’s Success Score (higher is better). We also flagged “hits” – a pick was considered a hit if he became a significant NBA player (for example, logging ~200+ games or posting strong per-game numbers). Hit Rate is the share of a team’s picks that met this threshold. In addition, we calculated Relative Efficiency (WS), defined as a player’s career Win Shares minus the median Win Shares for his draft slot. This highlights how much value above (or below) expected a pick provided given his draft position.
Overall Rankings
Here’s how each team fared on our metrics, sorted by Avg Success Score (the team’s average Success Score across its first-round picks). Avg Rel Efficiency shows the average Win Shares above (positive) or below (negative) what you’d expect from the draft slots they had. Teams that scored well typically got more production, found more “hits,” and nabbed more awards than their peers.
Team
Avg Success
Score
Hit
Rate
Avg
PPG
Avg
WS
Awards
Count
Rel Efficiency
WS
Minnesota Timberwolves71.987.5%15.128.397.7Los Angeles Lakers68.288.9%12.622.849.7Philadelphia 76ers64.4100%12.321.3113.0Cleveland Cavaliers62.183.3%12.520.826.7New Orleans Pelicans61.866.7%15.017.72-7.7Sacramento Kings59.2100%11.718.534.2Miami Heat59.180%11.419.737.3Toronto Raptors59.183.3%9.427.4314.9Charlotte Hornets58.987.5%11.817.23-1.8Denver Nuggets58.1100%12.421.753.5Atlanta Hawks53.380%11.119.552.6Dallas Mavericks52.1100%11.814.924.8Boston Celtics52.166.7%9.619.584.2Memphis Grizzlies52.040%10.611.233.6Orlando Magic51.377.8%9.520.835.5San Antonio Spurs49.875%11.419.818.2Houston Rockets49.5100%8.737.5032.7New York Knicks47.683.3%10.013.11-2.1Indiana Pacers46.880%8.620.109.1Chicago Bulls46.377.8%9.717.003.4Brooklyn Nets44.257.1%9.015.313.8Washington Wizards43.5100%9.111.80-2.5Phoenix Suns43.050%10.012.63-2.7Utah Jazz41.777.8%7.514.00-1.7Golden State Warriors37.060%7.712.70-2.0Oklahoma City Thunder36.466.7%7.211.005.0Milwaukee Bucks33.057.1%8.27.70-1.2Portland Trail Blazers31.271.4%7.47.700.2Detroit Pistons31.160%6.86.10-7.7Los Angeles Clippers26.325%6.05.30-7.2Best Value Picks
These are the 12 first-rounders from 2014–2020 who most outperformed their draft slot (by Relative Efficiency and overall impact):
25th – Clint Capela (Houston, 69.6 WS) – Became a double-double machine and defensive anchor far above what you expect from a late first-round pick.22nd – Jarrett Allen (Brooklyn, 66.7 WS) – An All-Star center who greatly outplayed the typical #22 pick, providing elite rim protection and efficiency.1st – Karl-Anthony Towns (Minnesota, 85.1 WS) – Delivered on his No. 1 overall hype and then some, becoming a multi-time All-Star and one of the top scoring big men of his generation.11th – Domantas Sabonis (Orlando, 69.9 WS) – A three-time All-Star and triple-double threat drafted outside the top 10; he blossomed into one of the league’s best passing bigs.14th – Bam Adebayo (Miami, 57.6 WS) – A two-time All-Star and Olympic gold medalist who far outperformed a mid-first selection, becoming a franchise centerpiece in Miami.11th – Shai Gilgeous-Alexander (Charlotte, 60.4 WS) – Picked outside the top 10, he became a first-team All-NBA guard and MVP contender, a huge win for his draft slot.29th – Derrick White (San Antonio, 39.7 WS) – Developed from the second-to-last pick of the first round into a solid NBA starter and playoff contributor.4th – Kristaps Porziņģis (New York, 48.0 WS) – A one-time All-Star and 20+ PPG scorer who lived up to (and exceeded) the typical output of a #4 pick, despite early doubts.4th – Aaron Gordon (Orlando, 46.9 WS) – A high-flying forward who became a key starter (and now NBA champion) – a better career than most #4 picks achieve.13th – Donovan Mitchell (Denver, 51.9 WS) – A four-time All-Star and one of the league’s elite scorers, drafted outside the lottery. He gave far more value than a typical 13th pick.13th – Devin Booker (Phoenix, 51.5 WS) – A three-time All-Star and 26 PPG scorer who vastly outplayed his #13 draft slot, emerging as a franchise superstar.27th – Pascal Siakam (Toronto, 55.5 WS) – A late-first steal who became an All-NBA forward and NBA champion, bringing Toronto enormous value for a #27 pick.Worst Value Picks
On the other end, these 12 first-round picks fell short of expectations (high picks who underperformed or barely made an impact):
3rd – Jahlil Okafor (Philadelphia, 7.2 WS) – A highly touted top-3 pick who never developed beyond a depth role, Okafor bounced around and was out of the league by his mid-20s.7th – Emmanuel Mudiay (Denver, -0.2 WS) – Struggled mightily as an NBA point guard. Despite ample opportunities, he posted negative overall value and was soon out of rotations.3rd – RJ Barrett (New York, 13.3 WS) – Has yet to justify the No. 3 selection. Through four seasons, he has been a volume scorer with modest efficiency and no All-Star appearances.7th – Killian Hayes (Detroit, -0.2 WS) – A recent top-7 pick who has thus far been one of the least efficient guards in the league, struggling to hold a starting job.3rd – LaMelo Ball (Charlotte, 13.6 WS) – Despite one All-Star nod, injuries have limited LaMelo’s impact. He hasn’t (yet) had the transformative effect expected of a #3 pick.1st – Markelle Fultz (Philadelphia, 8.4 WS) – A consensus #1 pick undone by shooting yips and injuries. Fultz reinvented himself as a serviceable guard, but he remains far below typical 1st-pick output.27th – Mfiondu Kabengele (Brooklyn, 0.4 WS) – A late first-rounder who barely saw NBA action, spending most of his time in the G League and failing to secure a rotation spot.6th – Jarrett Culver (Phoenix/Minnesota, -0.1 WS) – Never found his footing in the NBA. The 2019 sixth pick struggled offensively and was out of the league after just a few seasons.30th – Omari Spellman (Atlanta, 2.4 WS) – A “stretch” big taken at the end of the first round who flamed out quickly. He battled conditioning issues and was gone from the NBA after two years.27th – Udoka Azubuike (Utah, 2.0 WS) – A late-first project center who made minimal impact. He seldom cracked the lineup, recording just 2 Win Shares in three seasons for the Jazz.13th – Jerome Robinson (LA Clippers, -0.2 WS) – A lottery pick who never panned out. Robinson struggled with his shot and spent significant time in the G League before falling out of the league.13th – Georgios Papagiannis (Phoenix/Sacramento, 0.4 WS) – A surprise lottery selection in 2016, Papagiannis played only 39 NBA games. He was a major miss for a 13th pick, quickly returning overseas.Top Performers
Minnesota Timberwolves – Minnesota tops our rankings with the highest average Success Score and a strong hit rate. Despite often drafting high, the Wolves made their picks count. They nabbed stars in Karl-Anthony Towns and Anthony Edwards, got excellent value with mid/late first-rounders like Zach LaVine (#13 in 2014) and Lauri Markkanen (#7 in 2017), and even their lower-profile picks became solid contributors. Minnesota’s class produced multiple All-Stars and major award winners, giving the Timberwolves the NBA’s best first-round draft haul in this span.
Los Angeles Lakers – The Lakers turned nearly every one of their first-round picks into a quality player. From Julius Randle (2014) and Brandon Ingram (2016) to later picks like Larry Nance Jr. and Kyle Kuzma, Los Angeles consistently found talent. Several of these players blossomed into stars (often on other teams), like Ingram and D’Angelo Russell, but the Lakers’ draft record speaks for itself. They achieved an 88.9% hit rate, and their draftees accumulated a lot of Win Shares (on average ~23 WS each). In short, LA did an excellent job identifying NBA-ready talent in the first round.
Philadelphia 76ers – Philadelphia had the most first-round bites at the apple, and “The Process” yielded a league-best 100% hit rate. Every Sixers first-rounder became at least a serviceable NBA player, with two grand slams: Joel Embiid (an MVP and multiple-time scoring champ) and Ben Simmons (ROY and 3× All-Star). Philly’s picks also racked up 11 combined All-Star or major award honors – the highest total for any team – thanks largely to Embiid. Not every pick was a home run (e.g. Jahlil Okafor and Markelle Fultz had underwhelming careers), but even those guys logged some NBA production. Overall, the 76ers’ first-round output – especially in star power – was among the elites.
TakeawaysStar power lifts a class – One superstar can elevate an entire draft class. Teams like Minnesota (Towns/Edwards) and Philadelphia (Embiid) scored high largely because they hit on a franchise player.Draft position isn’t destiny – Late first-round steals can rival or exceed top-five picks. Players like Booker (#13) and Siakam (#27) outshone several top-five selections from the same years.High picks can bust – Having a lottery pick is no guarantee. Several teams (e.g. Phoenix with Dragan Bender, or Detroit with Hayes) saw top-10 picks yield very little. Missing on multiple high picks is devastating to a team’s overall draft success.Consistency and health matter – Teams got credit when their picks stayed on the court. Simply getting 200+ games out of a pick (even as a role player) boosted hit rates and success scores. Availability is a skill.Accumulating picks pays off – The teams that did best (Philly, Minnesota) had multiple first-rounders and capitalized on most of them. Conversely, teams that had few picks or traded them away (or whiffed on them, like the Clippers) languished at the bottom.Appendix: Draft Score Calculation
Success Score (0–100): Each player’s Success Score is a weighted sum of five percentile scores – Production (39% weight), Advanced Impact (22%), Availability (17%), Awards (6%), and Team Success (16%). For example, if a player’s stats placed him around the 90th percentile in Production and around the 50th percentile in Advanced Impact, those would contribute 35.1 (= 90×0.39) and 11.0 (= 50×0.22) points, respectivel,y to his Success Score. We scaled all categories to ensure no one stat dominated the composite score.
“Hit” definition: We defined a hit as a first-round pick who became a meaningful NBA contributor. In practical terms, that meant either playing a substantial number of games (roughly 200 or more) or posting strong averages (e.g. starting-level production) in fewer games. This is a fairly forgiving definition – it counts solid rotation players as hits, even if they never won awards. Hit Rate is simply the percentage of a team’s first-round picks from 2014–2020 that met these criteria.
Relative Efficiency (WS): This metric contextualizes a player’s Win Shares by draft slot. We gathered the historical median Win Shares for each pick number 1 through 30. A player’s Relative Efficiency is his career WS minus the median WS for his pick slot. Positive values mean the player outperformed the typical player at that draft position (and negative values mean the opposite). We averaged these for each team to see which teams consistently beat expectations with their picks.
Data sources: All player statistics (games played, PPG, WS, etc.) are from Basketball-Reference and are updated through the 2023–24 season. Awards and honors were cross-checked from official NBA records. Draft slot expected values (for WS) were computed from historical data. All calculations and formulas were done by the author in an accompanying workbook, available upon request. The above analysis focuses only on first-round picks from 2014–2020 and does not include any second-round selections.