

Big man Alex Sarr played well in the Washington Wizards 29-point loss to the Boston Celtics. NBAE via Getty Images
For 12 minutes, the Washington Wizards looked alright. They dashed out to a 12-point lead, closed the first quarter up 11, and the Celtics’ broadcast team fretted about Boston’s three-point bricklaying.
When Boston missed their eighth straight three — I didn’t doublecheck, but I think all eight were open or wide-open — I said aloud to the empty room, “If Boston ends the game shooting 25% from three, they’ll win by 15.”
And then…the Wizards got trucked.
-21 in the second quarter — going from up 11 to down 10 in the span of 12 minutes-12 in the third quarter-7 in the fourth
With a bit of math we can determine that over the final 36 minutes, Boston outscored Washington by 40 points.
And yeah, it really did look that bad.
After opening the game 2-11 from three-point range, Boston shot 14-30 the rest of the way to finish 16-41 — 39.0%.
This one got so out of hand, the Wizards posted their third best offensive rating (points per possession x 100) of the season (110) and lost by 29. Their defensive rating was an astonishing 140. Boston came into the game ranked 21st with a 114.5 offensive rating.
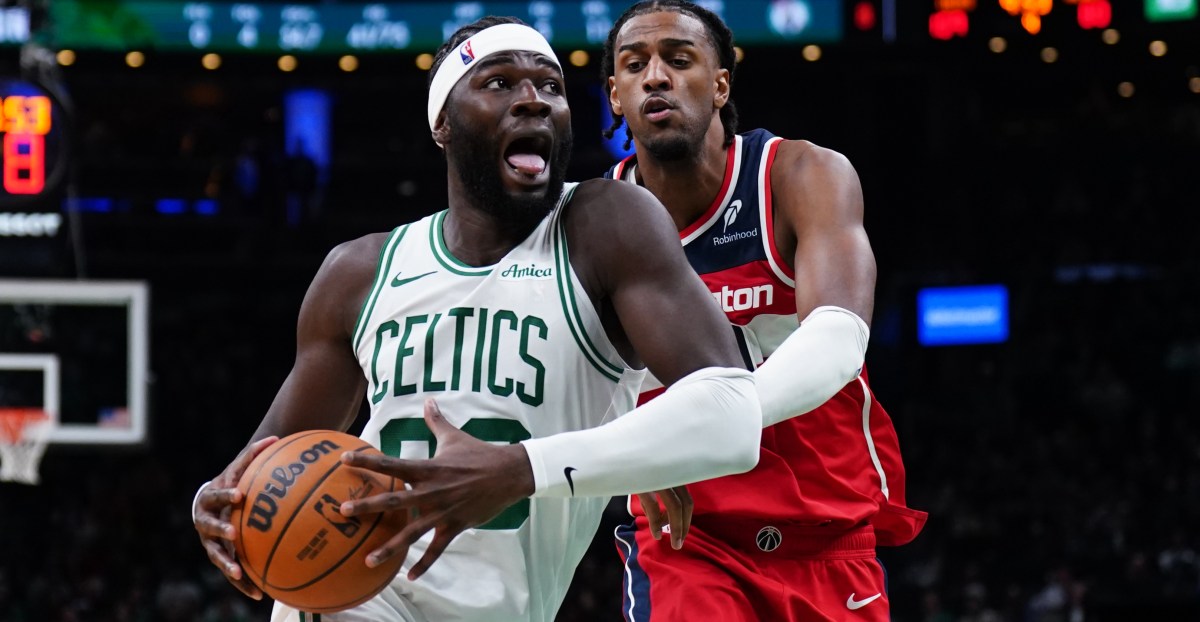
The Celtics broadcast reported that Jaylen Brown became just the fifth player in NBA history to post 35 points, 5 rebounds, and 5 assists in fewer than 26 minutes. The only player to hit those marks in less playing time was Michael Jordan.The Wizards made Neemias Queta look like an All-NBA center — 15 points, 12 rebounds, 5 assists, a steal and a block in 24 minutes. Queta made 7-7 from the floor.Josh Minott couldn’t get on the floor in three seasons with the Minnesota Timberwolves. He converted two lobs into dunks en route to a career-high 21 points on 12 shots. He also hit three threes and came up with three steals.Alex Sarr played well — 31 points (on a very good 139 offensive rating), 8 rebounds, 2 assists and 3 blocks — and the team was -26 in his 29 minutes. That was primarily due to the abysmal play of three starters: Bilal Coulibaly (0-5 from the floor and 2 turnovers), CJ McCollum (1-10 shooting), and Kyshawn George (3-9 from the floor, plus 3 turnovers and 5 fouls).Tre Johnson made it four Wizards players with negative PPA scores (more about PPA below).The worst plus-minus belonged to Bub Carrington — -30 in 31 minutes. Carrington managed 3 points, 5 rebounds, and 6 assists…and 3 turnovers.Corey Kispert made some shots.Marvin Bagley III grabbed five rebounds (2 offensive) in 13 minutes and scored inside.In his first extended action of the season, Malaki Branham looked decent. He seems to have good size for a guard though he didn’t showcase athletic explosiveness. He did finish with 10 points on five field goal attempts in 17 minutes, which is pretty good.I have questions about Washington’s defensive scheme. Last season, “Coach Nick” Hauselman joined my podcast to break down the Wizards defense. The big problem that jumped off the screen: helping from one pass away. What have I been seeing the Wizards do all season? Helping from one pass away. It makes it easy for opposing teams to get open threes.For the most part, this is about what I expected from the Wizards this season. When they’re competing and having some success, it can be fun to watch. On nights like this, it’s a slog.
Below are the four factors that decide wins and losses in basketball — shooting (efg), rebounding (offensive rebounds), ball handling (turnovers), fouling (free throws made).
The four factors are measured by:
eFG% (effective field goal percentage, which accounts for the three-point shot)OREB% (offensive rebound percentage)TOV% (turnover percentage — turnovers divided by possessions)FTM/FGA (free throws made divided by field goal attempts)
In the table below are the four factors using the percentages and rates traditionally presented.
FOUR FACTORSWIZARDSCELTICSLGAVGeFG%54.4%63.2%54.5%OREB%28.2%30.0%26.0%TOV%19.6%5.2%13.4%FTM/FGA0.2500.1680.231PACE97100.6ORTG110140115.4
PPA is my overall production metric, which credits players for things they do that help a team win (scoring, rebounding, playmaking, defending) and dings them for things that hurt (missed shots, turnovers, bad defense, fouls).
PPA is a per possession metric designed for larger data sets. In small sample sizes, the numbers can get weird. In PPA, 100 is average, higher is better and replacement level is 45. For a single game, replacement level isn’t much use, and I reiterate the caution about small samples sometimes producing weird results.
POSS is the number of possessions each player was on the floor in this game.
ORTG = offensive rating, which is points produced per individual possessions x 100. League average so far this season is 115.1. Points produced is not the same as points scored. It includes the value of assists and offensive rebounds, as well as sharing credit when receiving an assist.
USG = offensive usage rate. Average is 20%.
ORTG and USG are versions of stats created by former Wizards assistant coach Dean Oliver and modified by me. ORTG is an efficiency measure that accounts for the value of shooting, offensive rebounds, assists and turnovers. USG includes shooting from the floor and free throw line, offensive rebounds, assists and turnovers.
+PTS = “Plus Points” is a measure of the points gained or lost by each player based on their efficiency in this game compared to league average efficiency on the same number of possessions. A player with an offensive rating (points produced per possession x 100) of 100 who uses 20 possessions would produce 20 points. If the league average efficiency is 114, the league — on average — would produced 22.8 points in the same 20 possessions. So, the player in this hypothetical would have a +PTS score of -2.8.
Players are sorted by total production in the game.
WIZARDSMINPOSSORTGUSG+PTSPPA+/-Alex Sarr295913933.1%4.5222-26Justin Champagnie193819215.3%4.5199-9Malaki Branham173416316.6%2.7152-9Marvin Bagley III132614130.0%2.0185-1Corey Kispert132612022.2%0.2106-1Bub Carrington31621019.5%-0.836-30Will Riley122410514.0%-0.456-7Cam Whitmore8164719.6%-2.21-8Tre Johnson24498315.7%-2.5-43-15Bilal Coulibaly16334722.3%-5.1-135-8Kyshawn George28587621.5%-4.9-82-18CJ McCollum18355724.4%-5.0-133-9Tristan Vukcevic61316122.4%1.3171-2AJ Johnson61316610.6%0.7127-2CELTICSMINPOSSORTGUSG+PTSPPA+/-Jaylen Brown265214542.8%6.738511Derrick White295815116.9%3.527722Neemias Queta244920617.3%7.731423Josh Minott346815516.5%4.419718Payton Pritchard244813527.9%2.619236Jordan Walsh24481927.8%2.916127Anfernee Simons306011122.5%-0.6766Hugo Gonzalez17341379.7%0.7820Luka Garza71412622.1%0.3114-3Sam Hauser22456915.6%-3.3-313Baylor Scheierman48010.0%-0.9-2242