
The best thing about the Sacramento Kings is that the Wizards can say, “At least we’re not the Sacramento Kings.”
Yes, the Kings beat the Wizards, 128-115 last night. It was their 12th victory of the year — just two more than the Wizards. But Sacramento has been bad while also being the league’s third oldest team (weighted for minutes). The Wizards at bad and young, which means they can still peddle hope. The Kings don’t even have that.
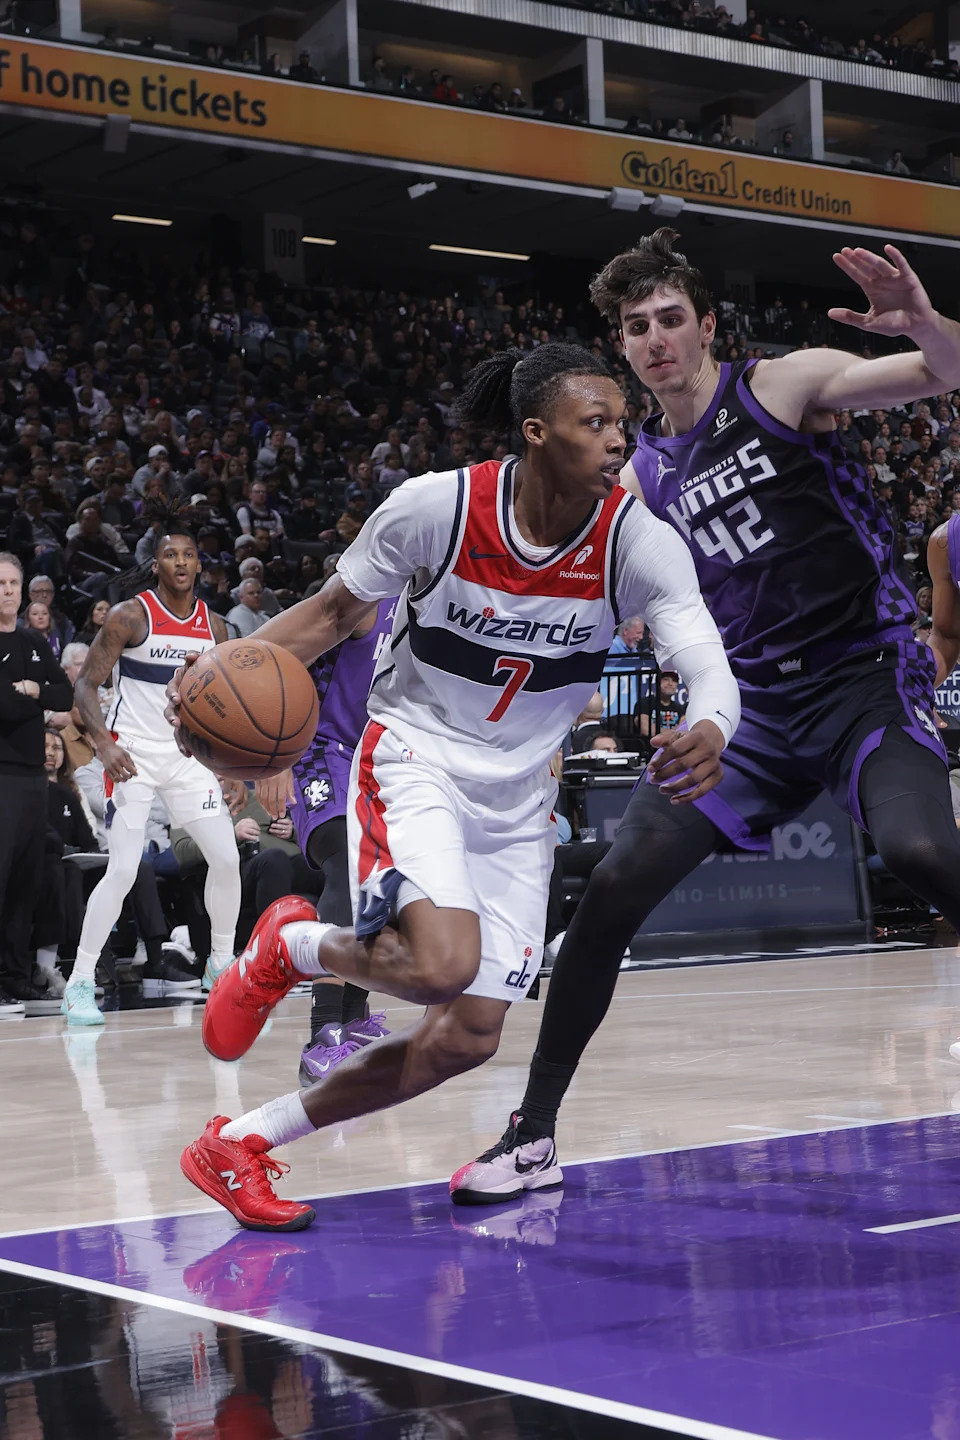
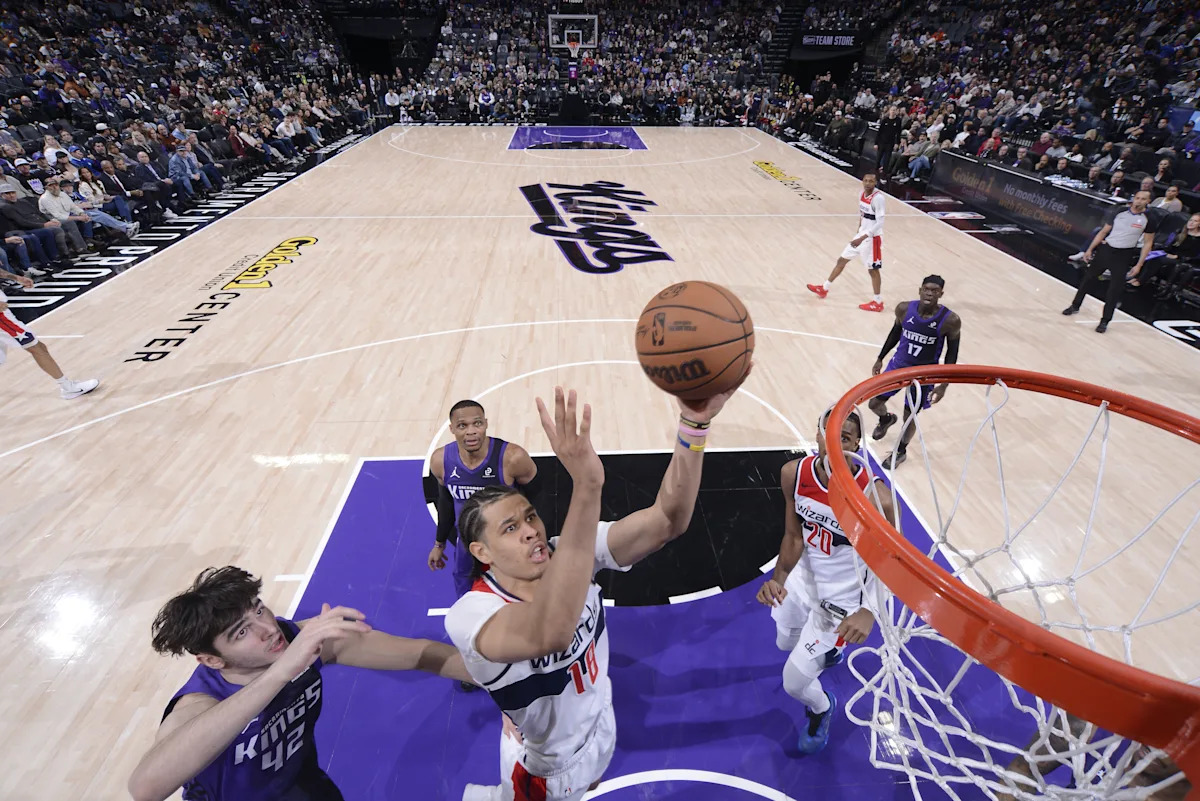
Washington Wizards guard Bub Carrington played a solid game in the team’s loss to the Sacramento Kings.
The Kings have no hope of being good with their current roster. They need to sell off their veterans for young players and draft picks. Their challenge is similar to where Washington was when Michael Winger and Will Dawkins took the helm — the older guys are pretty good with limitations and flaws, but their contracts are out of line with their production.
Advertisement
Their biggest challenge is the poor leadership of their owner Vivek Ranadive, which is something that likely won’t be rectified until he sells the team.
The game itself was at least somewhat entertaining. The Kings went on a 19-0 run to close the first quarter with a 19-point advantage. The teams played more or less even the rest of the way — the Wizards closing the gap to under five points a couple times in the second half. Each time, Sacramento responded with a run of their own to expand the margin.
It’s hard to overstate how bad Washington’s defense was in this one. The Kings entered the game with the league’s second worst offense, and with a generous helping of open and wide-open shots, posted a 128 offensive rating (points per possession x 100). That’s 18 points above their season average, and more than 12 points above league average.
The Kings achieved this absurd efficiency despite committing 18 turnovers and shooting just 19-30 on free throws. They connected on 15-31 (48.4%) from three-point range and posted an effective field goal percentage of 67.3%.
Advertisement
Russell Westbrook, a career 30.8% three-point shooter, shot 6-9 from deep, which boosted his three-point percentage this season to 35.7%.
Overall, the Wizards got decent production from their starting group (missing Khris Middleton and Bilal Coulibaly). Their bench — with the exception of Malaki Branham, who played probably the best game of his career — was a disaster.
Thoughts & Observations
Credit to head coach Brian Keefe for some tank-tastic lineup choices. For several (disastrous) minutes, he had a group out there that include AJ Johnson, Will Riley, Jamir Watkins, and Marvin Bagley III. I think the fifth was Bub Carrington. That grouping meant they had no one who could threaten the defense or lead an effective offense.
The Wizards were -22 in Johnson’s 11 minutes of action.
They were -19 in 22 minutes with Riley on the floor.
Carrington played 38 minutes and took just four shots, but was still productive overall with 9 assists and 2 steals.
Carrington has an odd mix of attributes. He’s 6-4 and rebounds at a level that suggests good size, strength, athleticism and competitiveness. He defends like a small, slow, weak guy — bigger players score at will when he defends in the post, quicker players drive with little resistance, his closeout are ineffective. He rarely drives, generates paint touches or gets shots at the rim, but is still an above-average playmaker. He’s shot well from deep, but has been astonishingly bad converting the few inside shots he gets.
While I liked seeing Justin Champagnie in the starting lineup, and his overall production was decent, I thought his defensive work was subpar — especially early in the game.
Four Factors
Below are the four factors that decide wins and losses in basketball — shooting (efg), rebounding (offensive rebounds), ball handling (turnovers), fouling (free throws made).
The four factors are measured by:
Advertisement
eFG% (effective field goal percentage, which accounts for the three-point shot)
OREB% (offensive rebound percentage)
TOV% (turnover percentage — turnovers divided by possessions)
FTM/FGA (free throws made divided by field goal attempts)
FOUR FACTORS
WIZARDS
KINGS
LGAVG
eFG%
55.0%
67.3%
54.4%
OREB%
17.5%
30.8%
26.2%
TOV%
11.0%
18.0%
12.8%
FTM/FGA
0.178
0.235
0.212
PACE
100
99.7
ORTG
115
128
115.7
Stats & Metrics
PPA is my overall production metric, which credits players for things they do that help a team win (scoring, rebounding, playmaking, defending) and dings them for things that hurt (missed shots, turnovers, bad defense, fouls).
PPA is a per possession metric designed for larger data sets. In small sample sizes, the numbers can get weird. In PPA, 100 is average, higher is better and replacement level is 45. For a single game, replacement level isn’t much use, and I reiterate the caution about small samples sometimes producing weird results.
POSS is the number of possessions each player was on the floor in this game.
Advertisement
ORTG = offensive rating, which is points produced per individual possessions x 100. League average so far this season is 115.1. Points produced is not the same as points scored. It includes the value of assists and offensive rebounds, as well as sharing credit when receiving an assist.
USG = offensive usage rate. Average is 20%.
ORTG and USG are versions of stats created by former Wizards assistant coach Dean Oliver and modified by me. ORTG is an efficiency measure that accounts for the value of shooting, offensive rebounds, assists and turnovers. USG includes shooting from the floor and free throw line, offensive rebounds, assists and turnovers.
+PTS = “Plus Points” is a measure of the points gained or lost by each player based on their efficiency in this game compared to league average efficiency on the same number of possessions. A player with an offensive rating (points produced per possession x 100) of 100 who uses 20 possessions would produce 20 points. If the league average efficiency is 114, the league — on average — would produced 22.8 points in the same 20 possessions. So, the player in this hypothetical would have a +PTS score of -2.8.
Advertisement
Players are sorted by total production in the game.
WIZARDS
MIN
POSS
ORTG
USG
+PTS
PPA
+/-
Bub Carrington
39
81
158
11.9%
4.0
123
2
Tre Johnson
30
62
109
24.9%
-1.0
121
-1
Kyshawn George
24
50
131
24.4%
1.9
146
-12
Alex Sarr
28
58
128
25.0%
1.7
123
-5
Justin Champagnie
27
56
149
17.4%
3.2
119
-12
Malaki Branham
13
28
145
25.6%
2.1
240
11
Marvin Bagley III
19
40
110
19.8%
-0.4
13
-8
AJ Johnson
11
24
63
25.2%
-3.2
-9
-22
Jamir Watkins
26
55
67
14.5%
-3.8
-25
0
Will Riley
22
46
68
19.5%
-4.3
-64
-18
Anthony Gill
1
2
0
34.7%
-0.9
-318
0
KINGS
MIN
POSS
ORTG
USG
+PTS
PPA
+/-
Russell Westbrook
31
65
145
25.4%
4.8
240
0
Precious Achiuwa
28
57
171
15.3%
4.8
212
-2
Zach LaVine
32
67
136
15.1%
2.0
128
10
Dennis Schroder
20
42
156
23.5%
3.9
203
12
Nique Clifford
19
39
135
18.6%
1.4
173
19
Domantas Sabonis
21
44
116
26.0%
0.0
126
14
Dylan Cardwell
19
39
149
14.2%
1.9
109
23
Maxime Raynaud
22
45
101
15.7%
-1.1
89
-7
DeMar DeRozan
33
68
111
21.0%
-0.7
51
-7
Malik Monk
16
33
60
27.0%
-4.9
-103
3