
Share


March Madness has been around in a four-region, 60-plus team format since 1985, when the NCAA DI men’s basketball tournament expanded to 64 schools, and later to 68 in 2011. Since 1985, thousands of games have been played in the NCAA tournament (not counting the First Four). That’s a lot of basketball. And with a lot of basketball comes a lot of points.
But which of those games are responsible for the most of those points? In other words, what are the highest-scoring games in modern NCAA tournament history (since expansion in 1985)?
Here are all the games that have surpassed 200 total points:
Rank
Total
Winning team
Score
Losing team
Score
Year
Round
1
264
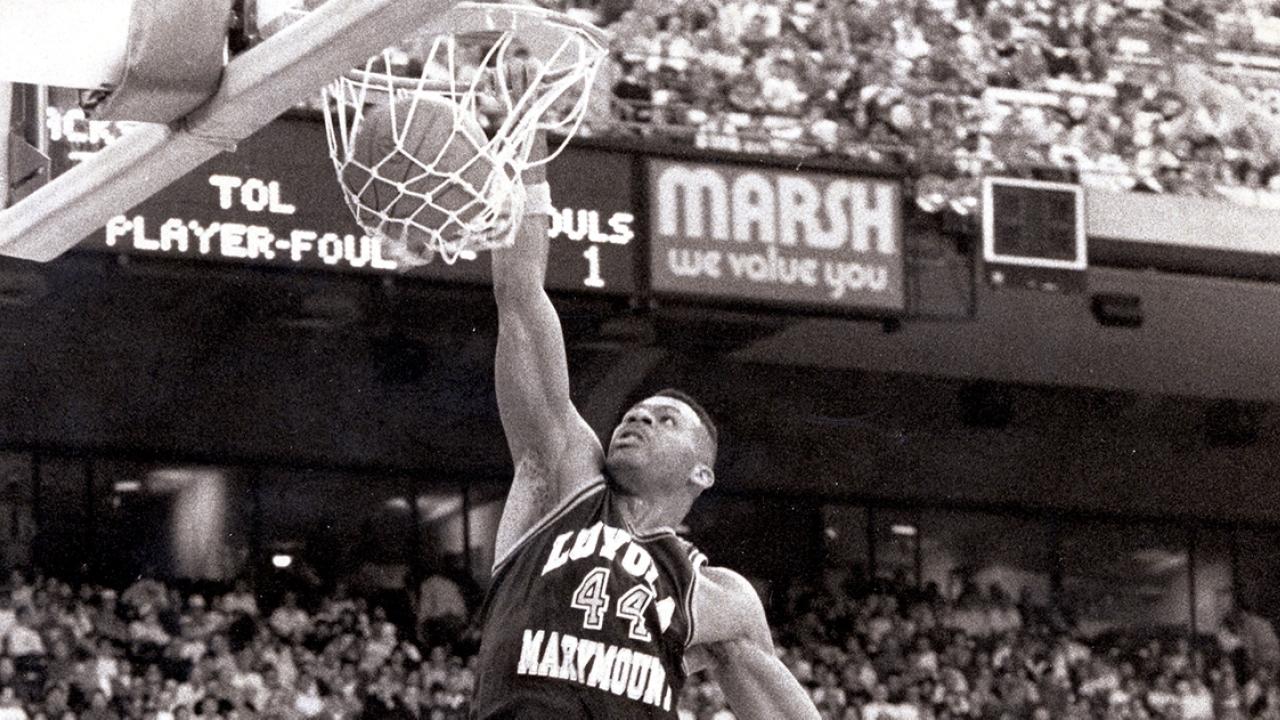
No. 11 seed Loyola Marymount
149
No. 3 seed Michigan
115
1990
Second round
2
234
No. 10 seed Loyola Marymount
119
No. 7 seed Wyoming
115
1988
First round
3
232
No. 1 seed UNLV
131
No. 11 seed Loyola Marymount
101
1990
Elite Eight
4
221
No. 5 seed Arkansas
120
No. 12 seed Loyola Marymount
101
1989
First round
5
220
No. 2 seed UNC
123
No. 10 seed Loyola Marymount
97
1988
Second round
6
216
No. 7 seed West Virginia
111
No. 2 seed Wake Forest
105
2005
Second round
7
214
No. 12 seed Tulsa
112
No. 5 seed UCLA
102
1994
First round
T8
207
No. 1 seed Duke
104
No. 2 seed Kentucky
103
1992
Elite Eight
T8
207
No. 5 seed Tennessee
121
No. 12 seed Long Beach State
86
2007
First round
T10
206
No. 1 seed UNC
109
No. 9 seed Michigan
97
1987
Second round
T10
206
No. 1 seed Oklahoma
108
No. 5 seed Louisville
98
1988
Sweet 16
T10
206
No. 8 seed UCLA
105
No. 1 seed Cincinnati
101
2002
Second round
T13
205
No. 1 seed Oklahoma
124
No. 9 seed Louisiana Tech
81
1989
Second round
T13
205
No. 1 seed Missouri
109
No. 9 seed Wisconsin
96
1994
Second round
T13
205
No. 4 seed Alabama
109
No. 13 seed Charleston
96
2024
First round
16
204
No. 2 seed Kentucky
106
No. 10 seed Iowa State
98
1992
Second round
17
203
No. 11 seed Loyola Marymount
111
No. 10 seed Iowa State
98
1990
First round
T18
202
No. 9 seed UAB
102
No. 8 seed Washington
100
2004
First round
T18
202
No. 10 seed Colorado
102
No. 7 seed Florida
100
2024
First round
20
201
No. 2 seed Alabama
113
No. 6 seed BYU
88
2025
Sweet 16
T21
200
No. 5 seed Iowa
102
No. 12 seed Florida State
98
1988
First round
T21
200
No. 12 seed Western Kentucky
101
No. 5 seed Drake
99
2008
First round
Yes, we see it too. Somehow, Loyola Marymount is involved in all five of the highest-scoring games, and six of the top 16. Why?
In the three-year span from 1988-1990, the Lions led the NCAA in points scored per game AND points allowed per game each year. And it wasn’t close:
Loyola Marymount P/G
Runner-up P/G
Difference
Loyola Marymount PA/G
Runner-up PA/G
Difference
1988
110.3
102.9
7.4
97.2
93.6
3.6
1989
112.5
102.2
10.3
107.3
96.2
11.1
1990
122.4
101.3
21.1
108.1
102
6.1
In 1990, when two of the top three highest-scoring NCAA tournament games were recorded, the Lions’ games were averaging 230.5 total points — 30.7 more than the next highest team. That’s about as perfect a recipe for record-breaking box scores as you can get.
During that three-year span, Loyola Marymount combined with its opponent to score more than 200 points in a game 62 times. The other five teams in the top five did that a total of just 12 times.
But the Lions were masters of getting other teams to play at their pace. Of the teams the Lions combined with to set the top five highest-scoring games, all averaged fewer than 80 points allowed per game.
What’s more, only one averaged more than 90 points per game — 1990 UNLV at 93.5. The Running Rebels would go on to beat Duke in the national championship that year, 103-73 — a game that happens to be the highest-scoring championship game in modern tournament history.
Related: Hank Gathers’ son remembers his father
To see exactly how these records took shape, take a look at these absurd box scores for each of the top five:
No. 1) 1990 second round: No. 11 seed Loyola Marymount 149, No. 3 seed Michigan 115
LOYOLA MARYMOUNT
FG
FGA
FG%
2P
2PA
2P%
3P
3PA
3P%
FT
FTA
FT%
TRB
AST
PTS
Bo Kimble
11
29
37.9%
10
21
47.6%
1
8
12.5%
14
17
82.4%
7
4
37
Jeff Fryer
15
20
75%
4
5
80%
11
15
73.3%
0
0
–
4
3
41
Per Stumer
6
9
66.7%
1
1
100%
5
8
62.5%
4
4
100%
8
2
21
Tony Walker
0
2
0%
0
2
0%
0
0
–
5
7
71.4%
3
9
5
Chris Knight
2
5
40%
2
5
40%
0
0
–
0
0
–
6
3
4
Terrell Lowery
10
17
58.8%
7
9
77.8%
3
8
37.5%
0
0
–
3
6
23
Tom Peabody
4
5
80%
4
5
80%
0
0
–
6
6
100%
3
5
14
Marcellus Lee
1
1
100%
0
0
–
1
1
100%
0
0
–
2
0
3
Greg Walker
0
0
–
0
0
–
0
0
–
1
2
50%
0
0
1
John O’Connell
0
0
–
0
0
–
0
0
–
0
0
–
0
0
0
Jeff Roscoe
0
0
–
0
0
–
0
0
–
0
0
–
0
0
0
Marcus Slater
0
0
–
0
0
–
0
0
–
0
0
–
0
0
0
Christian Scott
0
1
0%
0
1
0%
0
0
–
0
0
–
2
1
0
TEAM
49
89
55.1%
28
49
57.1%
21
40
52.5%
30
36
83.3%
38
33
149
MICHIGAN
FG
FGA
FG%
2P
2PA
2P%
3P
3PA
3P%
FT
FTA
FT%
TRB
AST
PTS
Rumeal Robinson
7
14
50%
5
8
62.5%
2
6
33.3%
7
10
70%
3
8
23
Terry Mills
11
16
68.8%
11
16
68.8%
0
0
–
1
2
50%
10
1
23
Demetrius Calip
2
8
25%
2
8
25%
0
0
–
6
8
75%
5
3
10
Loy Vaught
9
15
60%
9
15
60%
0
0
–
1
3
33.3%
17
0
19
Mike Griffin
2
4
50%
2
4
50%
0
0
–
0
0
–
1
5
4
Sean Higgins
5
13
38.5%
4
9
44.4%
1
4
25%
4
4
100%
3
2
15
Michael Talley
1
3
33.3%
1
2
50%
0
1
0%
1
2
50%
2
1
3
Tony Tolbert
7
11
63.6%
6
9
66.7%
1
2
50%
1
1
100%
2
1
16
Eric Riley
1
1
100%
1
1
100%
0
0
–
0
0
–
3
0
2
Chris Seter
0
0
–
0
0
–
0
0
–
0
0
–
0
0
0
James Voskuil
0
0
–
0
0
–
0
0
–
0
0
–
0
0
0
TEAM
45
85
52.9%
41
72
56.9%
4
13
30.8%
21
30
70%
46
21
115
No. 2) 1988 first round: No. 10 seed Loyola Marymount 119, No. 7 seed Wyoming 115
LOYOLA MARYMOUNT
FG
FGA
FG%
2P
2PA
2P%
3P
3PA
3P%
FT
FTA
FT%
TRB
AST
PTS
Mike Yoest
5
9
55.6%
5
9
55.6%
0
0
–
15
17
88.2%
9
2
25
Hank Gathers
9
15
60%
9
15
60%
0
0
–
1
4
25%
12
2
19
Bo Kimble
12
22
54.5%
8
13
61.5%
4
9
44.4%
1
3
33.3%
2
3
29
Mark Armstrong
6
8
75%
6
8
75%
0
0
–
3
5
60%
8
2
15
Corey Gaines
3
9
33.3%
3
7
42.9%
0
2
0%
3
4
75%
2
10
9
Jeff Fryer
5
11
45.5%
2
5
40%
3
6
50%
4
4
100%
3
1
17
Enoch Simmons
2
8
25%
1
5
20%
1
3
33.3%
0
0
–
4
3
5
John Veargason
0
0
–
0
0
–
0
0
–
0
0
–
0
0
0
TEAM
42
82
51.2%
34
62
54.8%
8
20
40%
27
37
73%
40
23
119
WYOMING
FG
FGA
FG%
2P
2PA
2P%
3P
3PA
3P%
FT
FTA
FT%
TRB
AST
PTS
Eric Leckner
10
17
58.8%
10
17
58.8%
0
0
–
3
4
75%
8
2
23
Fennis Dembo
5
11
45.5%
5
8
62.5%
0
3
0%
4
6
66.7%
7
8
14
Robyn Davis
9
15
60%
8
13
61.5%
1
2
50%
0
0
–
6
1
19
Willie Jones
4
7
57.1%
4
7
57.1%
0
0
–
4
6
66.7%
10
5
12
Turk Boyd
4
11
36.4%
4
8
50%
0
3
0%
1
1
100%
5
3
9
Sean Dent
2
3
66.7%
2
3
66.7%
0
0
–
0
0
–
2
6
4
Reggie Fox
7
9
77.8%
5
5
100%
2
4
50%
0
0
–
2
3
16
Clauzell Williams
3
4
75%
1
2
50%
2
2
100%
3
4
75%
3
0
11
Jonathan Sommers
2
2
100%
2
2
100%
0
0
–
0
0
–
0
1
4
David Lodgins
0
1
0%
0
1
0%
0
0
–
0
0
–
0
0
0
Rod Tyson
1
2
50%
0
0
–
1
2
50%
0
0
–
1
0
3
Kurt Samuels
0
0
–
0
0
–
0
0
–
0
0
–
0
0
0
TEAM
47
82
57.3%
41
66
62.1%
6
16
37.5%
15
21
71.4%
44
29
115
No. 3) 1990 Elite Eight: No. 1 seed UNLV 131, No. 11 seed Loyola Marymount 101
UNLV
FG
FGA
FG%
2P
2PA
2P%
3P
3PA
3P%
FT
FTA
FT%
TRB
AST
PTS
Anderson Hunt
11
23
47.8%
7
11
63.6%
4
12
33.3%
4
6
66.7%
4
13
30
Larry Johnson
10
14
71.4%
10
14
71.4%
0
0
–
0
1
0%
18
5
20
Stacey Augmon
13
20
65%
13
20
65%
0
0
–
7
7
100%
11
6
33
Greg Anthony
8
10
80%
5
6
83.3%
3
4
75%
2
3
66.7%
1
8
21
David Butler
4
7
57.1%
4
7
57.1%
0
0
–
1
5
20%
8
2
9
Moses Scurry
3
4
75%
3
4
75%
0
0
–
2
2
100%
4
0
8
Stacey Cvijanovich
0
0
–
0
0
–
0
0
–
2
2
100%
2
0
2
James Jones
2
3
66.7%
2
3
66.7%
0
0
–
3
4
75%
3
0
7
Barry Young
0
0
–
0
0
–
0
0
–
0
0
–
2
0
0
Travis Bice
0
4
0%
0
2
0%
0
2
0%
1
2
50%
1
1
1
Dave Rice
0
0
–
0
0
–
0
0
–
0
0
–
1
0
0
Chris Jeter
0
1
0%
0
1
0%
0
0
–
0
0
–
1
0
0
TEAM
51
86
59.3%
44
68
64.7%
7
18
38.9%
22
32
68.8%
56
35
131
LOYOLA MARYMOUNT
FG
FGA
FG%
2P
2PA
2P%
3P
3PA
3P%
FT
FTA
FT%
TRB
AST
PTS
Bo Kimble
14
32
43.8%
6
21
28.6%
8
11
72.7%
6
6
100%
11
3
42
Jeff Fryer
7
24
29.2%
3
8
37.5%
4
16
25%
3
3
100%
6
2
21
Per Stumer
2
4
50%
2
2
100%
0
2
0%
0
0
–
5
2
4
Tony Walker
1
1
100%
1
1
100%
0
0
–
2
3
66.7%
2
3
4
Chris Knight
4
8
50%
4
8
50%
0
0
–
0
0
–
2
2
8
Terrell Lowery
6
16
37.5%
2
7
28.6%
4
9
44.4%
2
2
100%
0
6
18
Tom Peabody
0
2
0%
0
0
–
0
2
0%
0
1
0%
2
4
0
John O’Connell
0
0
–
0
0
–
0
0
–
1
2
50%
2
0
1
Marcellus Lee
1
2
50%
0
1
0%
1
1
100%
0
0
–
0
0
3
Jeff Roscoe
0
0
–
0
0
–
0
0
–
0
0
–
1
0
0
Marcus Slater
0
2
0%
0
2
0%
0
0
–
0
0
–
1
0
0
Greg Walker
0
1
0%
0
1
0%
0
0
–
0
0
–
1
0
0
Christian Scott
0
2
0%
0
2
0%
0
0
–
0
0
–
1
1
0
TEAM
35
94
37.2%
18
53
34%
17
41
41.5%
14
17
82.4%
34
23
101
No. 4) 1989 first round: No. 5 seed Arkansas 120, No. 12 seed Loyola Marymount 101
ARKANSAS
FG
FGA
FG%
2P
2PA
2P%
3P
3PA
3P%
FT
FTA
FT%
TRB
AST
PTS
Lee Mayberry
8
14
57.1%
7
13
53.8%
1
1
100%
2
6
33.3%
2
8
19
Lenzie Howell
10
11
90.9%
10
11
90.9%
0
0
–
7
11
63.6%
12
0
27
Keith Wilson
4
13
30.8%
4
11
36.4%
0
2
0.0%
1
3
33.3%
11
12
9
Mario Credit
14
21
66.7%
14
21
66.7%
0
0
–
6
9
66.7%
13
0
34
Todd Day
7
12
58.3%
6
9
66.7%
1
3
33.3%
5
6
83.3%
2
4
20
Arlyn Bowers
2
7
28.6%
2
5
40%
0
2
0%
3
4
75%
1
3
7
Oliver Miller
0
0
–
0
0
–
0
0
–
0
2
0.0%
5
0
0
Darrell Hawkins
1
1
100%
1
1
100%
0
0
–
0
0
–
1
0
2
Cannon Whitby
1
2
50%
1
1
100%
0
1
0%
0
0
–
1
1
2
Shawn Davis
0
0
–
0
0
–
0
0
–
0
0
–
0
2
0
TEAM
47
81
58%
45
72
62.5%
2
9
22.2%
24
41
58.5%
48
30
120
LOYOLA MARYMOUNT
FG
FGA
FG%
2P
2PA
2P%
3P
3PA
3P%
FT
FTA
FT%
TRB
AST
PTS
Hank Gathers
12
24
50%
12
24
50%
0
0
–
4
11
36.4%
17
1
28
Bo Kimble
7
23
30.4%
5
12
41.7%
2
11
18.2%
8
9
88.9%
10
3
24
Jeff Fryer
7
28
25%
2
6
33.3%
5
22
22.7%
5
5
100%
8
1
24
Per Stumer
2
7
28.6%
1
4
25%
1
3
33.3%
1
2
50%
8
1
6
Tom Peabody
1
4
25%
1
3
33.3%
0
1
0%
0
1
0%
4
4
2
John Veargason
3
7
42.9%
3
7
42.9%
0
0
–
0
0
–
7
0
6
Terrell Lowery
2
3
66.7%
1
1
100%
1
2
50%
2
2
100%
2
1
7
Terry Mister
0
0
–
0
0
–
0
0
–
2
2
100%
0
1
2
John O’Connell
1
2
50%
1
2
50%
0
0
–
0
0
–
2
1
2
TEAM
35
98
35.7%
26
59
44.1%
9
39
23.1%
22
32
68.8%
58
13
101
No. 5) 1988 second round: No. 2 seed UNC 123, No. 10 seed Loyola Marymount 97
UNC
FG
FGA
FG%
2P
2PA
2P%
3P
3PA
3P%
FT
FTA
FT%
TRB
AST
PTS
Jeff Lebo
6
9
66.7%
3
5
60%
3
4
75%
4
4
100%
5
7
19
J.R. Reid
8
10
80%
8
10
80%
0
0
–
3
6
50%
15
5
19
Kevin Madden
7
9
77.8%
7
9
77.8%
0
0
–
2
2
100%
4
9
16
Scott Williams
3
3
100%
3
3
100%
0
0
–
2
2
100%
8
3
8
Steve Bucknall
5
7
71.4%
5
7
71.4%
0
0
–
3
5
60%
5
3
13
Rick Fox
4
4
100.0%
4
4
100.0%
0
0
–
0
0
–
4
4
8
Ranzino Smith
11
14
78.6%
8
9
88.9%
3
5
60%
2
3
66.7%
4
0
27
Pete Chilcutt
2
2
100%
2
2
100%
0
0
–
1
3
33.3%
6
2
5
King Rice
1
1
100%
1
1
100%
0
0
–
2
2
100%
1
2
4
Joe Jenkins
1
2
50%
1
2
50%
0
0
–
0
0
–
1
1
2
Jeff Denny
0
0
–
0
0
–
0
0
–
0
0
–
1
0
0
Rodney Hyatt
1
1
100%
1
1
100%
0
0
–
0
0
–
0
0
2
Doug Elstun
0
0
–
0
0
–
0
0
–
0
0
–
0
0
0
David May
0
0
–
0
0
–
0
0
–
0
0
–
0
0
0
TEAM
49
62
79%
43
53
81.1%
6
9
66.7%
19
27
70.4%
54
36
123
LOYOLA MARYMOUNT
FG
FGA
FG%
2P
2PA
2P%
3P
3PA
3P%
FT
FTA
FT%
TRB
AST
PTS
Corey Gaines
5
20
25%
4
15
26.7%
1
5
20%
5
6
83.3%
1
10
16
Mike Yoest
2
10
20%
2
9
22.2%
0
1
0%
6
10
60%
12
2
10
Bo Kimble
3
21
14.3%
2
12
16.7%
1
9
11.1%
1
2
50%
3
1
8
Mark Armstrong
3
7
42.9%
3
7
42.9%
0
0
–
1
2
50%
3
1
7
Hank Gathers
7
17
41.2%
7
17
41.2%
0
0
–
3
10
30%
12
0
17
Enoch Simmons
4
11
36.4%
0
2
0%
4
9
44.4%
0
0
–
4
2
12
Jeff Fryer
9
16
56.3%
2
2
100%
7
14
50%
2
2
100%
2
1
27
John Veargason
0
0
–
0
0
–
0
0
–
0
0
–
2
0
0
Marcus Slater
0
1
0%
0
0
–
0
1
0%
0
0
–
0
0
0
Pat Meyer
0
0
–
0
0
–
0
0
–
0
0
–
0
0
0
Marcellus Lee
0
0
–
0
0
–
0
0
–
0
0
–
0
0
0
Jeff Roscoe
0
0
–
0
0
–
0
0
–
0
0
–
0
0
0
TEAM
33
103
32%
20
64
31.3%
13
39
33.3%
18
32
56.3%
39
17
97
Daniel Wilco has worked at the AJC, Sports Illustrated, and SEC Country. His writing has also appeared on SI.com, Men’s Health, and The Cauldron.
The views on this page do not necessarily reflect the views of the NCAA or its member institutions.
The First Four of the NCAA tournament | The ultimate guide
The First Four is the official start to March Madness. Here’s everything you need to know.
March Madness: One stat shows AP No. 1 is far from a championship lock
It seems like a safe pick. But it’s happened only five times since the tournament expanded to 64 teams in 1985.
March Madness brackets: How do seeds perform in the Final Four?
Here are how many times each seed has made the Final Four of the NCAA men’s basketball tournament.