
This matchup with the Brooklyn Nets was the Wizards’ most important game of the season, and they came prepared. Shorthanded because of the Anthony Davis trade — apparently, it’s a long walk from Dallas to DC — the Wizards sat mainstays Bilal Coulibaly, Kyshawn George, and Alex Sarr with “injuries.”
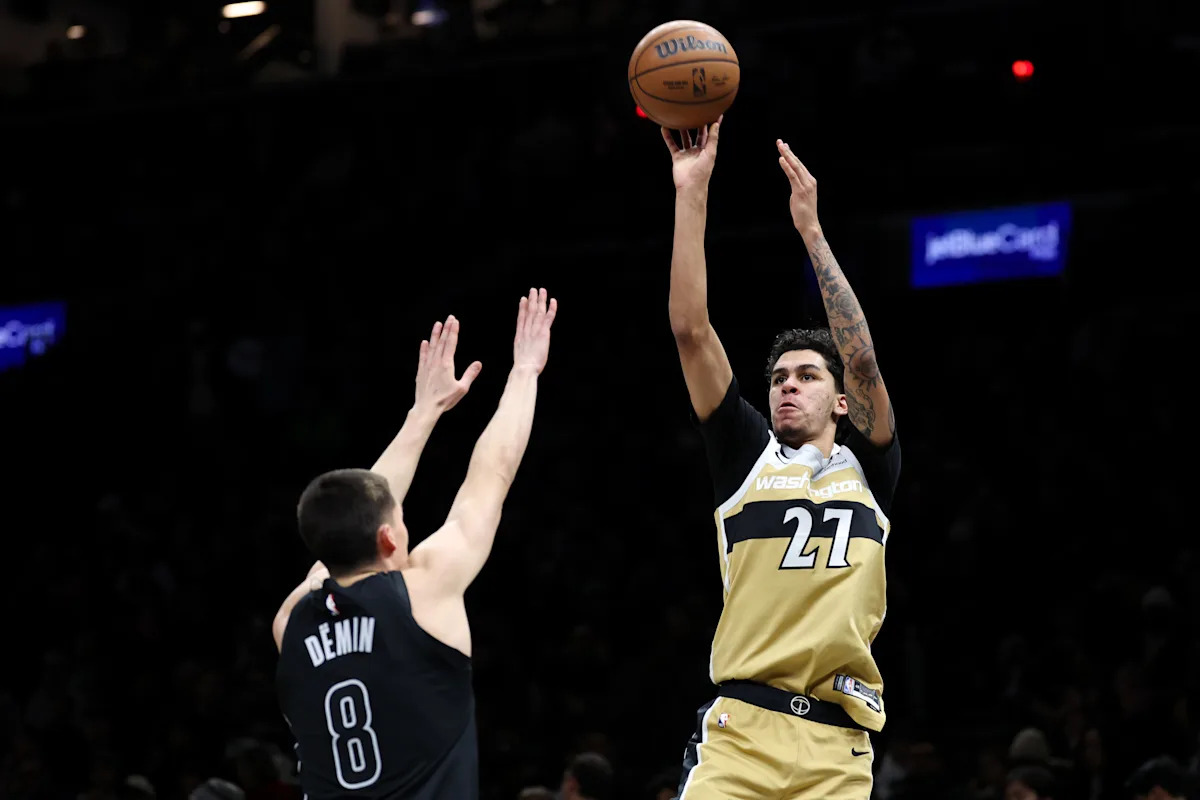
Also sitting this one out: Trae Young (“injury”), Tre Johnson (sprained ankle), and Cam Whitmore (deep vein thrombosis).
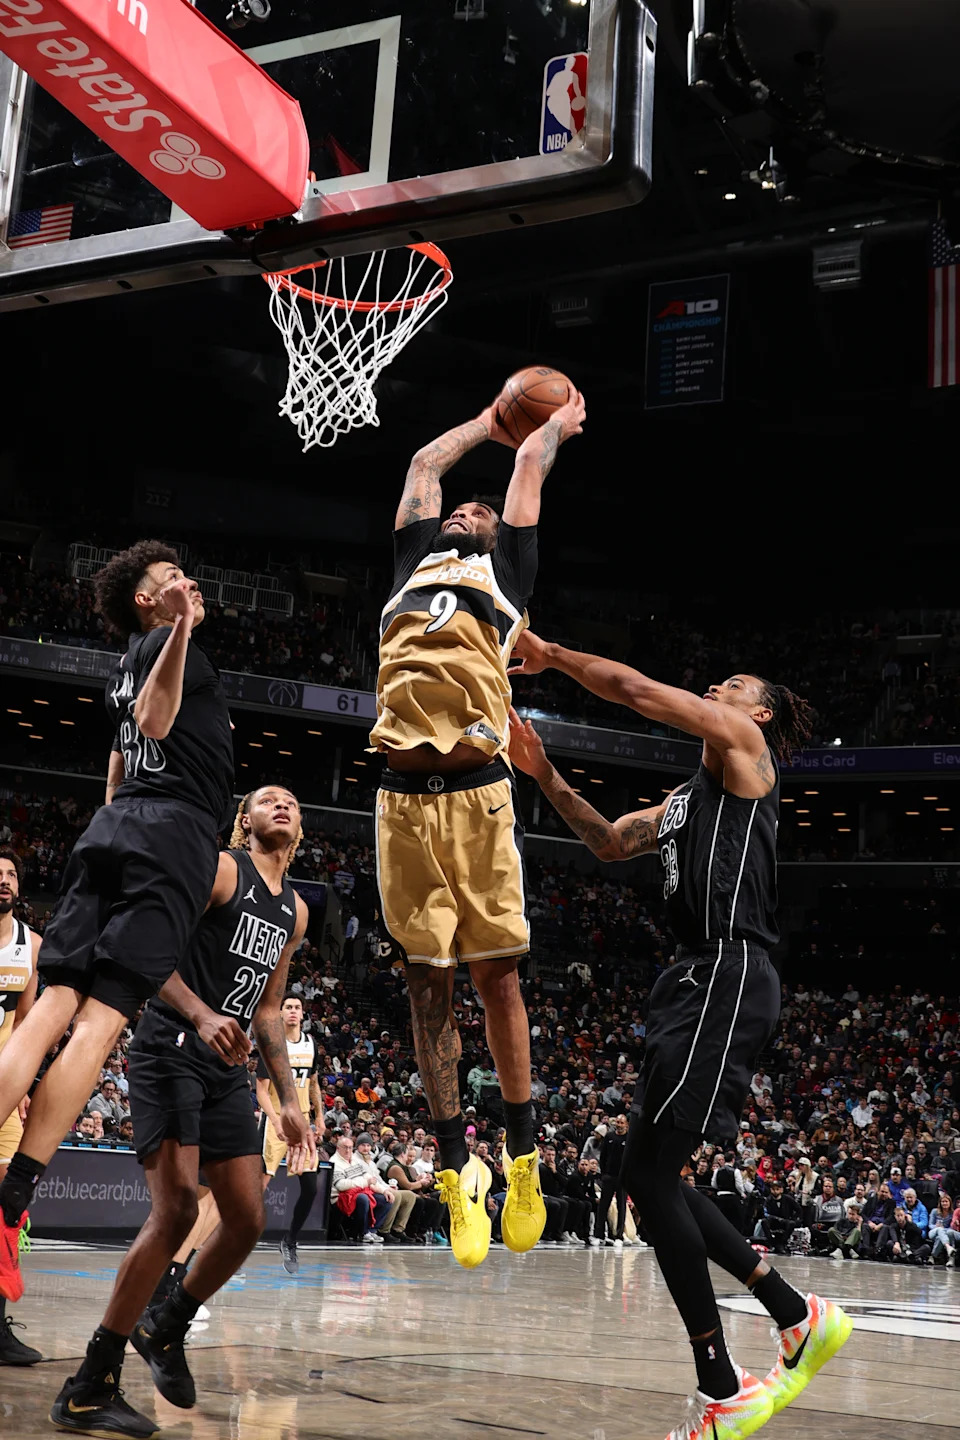
Too good to play: Justin Champagnie produced 21 points and 9 rebounds in just 22 minutes in the Wizards’ all-important loss to the Brooklyn Nets. | NBAE via Getty Images
And darn the luck, Skal Labissiere’s 10-day contract expired, and they couldn’t come to an agreement on another one. Or something. The front office didn’t forget that 10-day contracts exist — they gave one to Keshon Gilbert, who’s been playing for the Capital City Go-Go. Gilbert got 29 minutes.
Advertisement
Also, starters like Justin Champagnie (22 minutes), Tristan Vukcevich (20 minutes), and Bub Carrington (22 minutes) were apparently on some kind of minutes restriction. Presumably to protect their health.
Oh yeah, did I mention it was critical for the Wizards to lose this one? Yeah, it was essential. At 13-37, the Nets were a game ahead of Washington in the quest for better draft lottery odds. Losing this one puts the team’s in a virtual tie, but the Wizards are now 1-2 against Brooklyn, which means they have the tie-breaker. The teams have one more game against each other (likely a must-lose for both, which might lead to tank-tacular shenanigans), which is April 5. Mark your calendars.
Despite all that preparation, the Wizards played the Nets close for the first 6-7 minutes. Then Brian Keefe went to the bench, and things avalanched. Washington gave up 46 points and trailed by 26 after the first quarter. They fell behind by as much as 34 before mounting a second half comeback that got them as close as 12. Kudos to the available for playing hard throughout.
Thoughts & Observations
Champagnie had 21 points on 8 shots to go with 9 rebounds and 2 blocks in just 22 minutes.
Good offensive game from Will Riley, who scored 27 points on very good efficiency (129 offensive rating). He managed just three rebounds and two assists in 45 minutes. The three steals and a block were nice.
Sharife Cooper had another solid game — 14 points, 5 rebounds, 3 assists — though the team was -20 with him out there.
I’ve not been impressed by Danny Wolf so far this season, but he played the game of his (short) NBA life against Washington — 7-11 from the floor, 16 points, 7 rebounds, 6 assists, and zero turnovers.
Nolan Traore is fast. YODA didn’t like him much as a draft prospect, but I can see what the eyeball scouts saw in him. So far, on balance, YODA is looking more likely to be correct. We’ll see.
Michael Porter Jr. had a decent though subpar game (for him). Overall, his numbers this season look eerily like they did when he was with the Denver Nuggets and Nikola Jokic was not in the game.
Advertisement
Four Factors
Below are the four factors that decide wins and losses in basketball — shooting (efg), rebounding (offensive rebounds), ball handling (turnovers), fouling (free throws made).
The four factors are measured by:
eFG% (effective field goal percentage, which accounts for the three-point shot)
OREB% (offensive rebound percentage)
TOV% (turnover percentage — turnovers divided by possessions)
FTM/FGA (free throws made divided by field goal attempts)
FOUR FACTORS
WIZARDS
NETS
LGAVG
eFG%
53.8%
62.1%
54.3%
OREB%
13.5%
34.2%
26.1%
TOV%
15.1%
13.1%
12.7%
FTM/FGA
0.354
0.154
0.208
PACE
99
99.4
ORTG
114
128
115.5
Stats & Metrics
PPA is my overall production metric, which credits players for things they do that help a team win (scoring, rebounding, playmaking, defending) and dings them for things that hurt (missed shots, turnovers, bad defense, fouls).
PPA is a per possession metric designed for larger data sets. In small sample sizes, the numbers can get weird. In PPA, 100 is average, higher is better and replacement level is 45. For a single game, replacement level isn’t much use, and I reiterate the caution about small samples sometimes producing weird results.
Advertisement
POSS is the number of possessions each player was on the floor in this game.
ORTG = offensive rating, which is points produced per individual possessions x 100. League average so far this season is listed in the Four Factors table above. Points produced is not the same as points scored. It includes the value of assists and offensive rebounds, as well as sharing credit when receiving an assist.
USG = offensive usage rate. Average is 20%.
ORTG and USG are versions of stats created by former Wizards assistant coach Dean Oliver and modified by me. ORTG is an efficiency measure that accounts for the value of shooting, offensive rebounds, assists and turnovers. USG includes shooting from the floor and free throw line, offensive rebounds, assists and turnovers.
Advertisement
+PTS = “Plus Points” is a measure of the points gained or lost by each player based on their efficiency in this game compared to league average efficiency on the same number of possessions. A player with an offensive rating (points produced per possession x 100) of 100 who uses 20 possessions would produce 20 points. If the league average efficiency is 115, the league — on average — would produced 23.0 points in the same 20 possessions. So, the player in this hypothetical would have a +PTS score of -3.0.
Players are sorted by total production in the game.
WIZARDS
MIN
POSS
ORTG
USG
+PTS
PPA
+/-
Will Riley
45
93
129
20.2%
2.6
130
-12
Justin Champagnie
22
46
147
34.2%
4.9
246
4
Sharife Cooper
29
59
134
17.2%
1.9
106
-20
Tristan Vukcevich
20
42
110
27.5%
-0.7
69
-2
Anthony Gill
28
57
110
15.8%
-0.5
43
-12
Bub Carrington
22
46
92
27.8%
-3.0
15
4
Jamir Watkins
45
93
95
13.7%
-2.6
4
-12
Keshon Gilbert
29
59
68
14.0%
-3.9
-23
-20
NETS
MIN
POSS
ORTG
USG
+PTS
PPA
+/-
Danny Wolf
20
41
167
24.5%
5.1
305
24
Day’Ron Sharpe
20
41
143
32.8%
3.7
294
26
Nolan Traore
24
49
184
15.3%
5.1
183
-18
Michael Porter Jr.
31
63
120
27.8%
0.9
132
-8
Noah Clowney
27
56
140
20.6%
2.9
147
-14
Ben Saraf
24
50
108
19.6%
-0.8
128
32
Nic Claxton
28
59
133
16.0%
1.7
95
-12
Terance Mann
19
39
114
18.3%
-0.1
133
26
Drake Powell
22
46
88
12.0%
-1.5
9
24
Egor Demin
26
53
57
13.8%
-4.3
-22
-10