
The best thing about the Wizards blowout loss to the Miami Heat is that it’s over. Miami weathered an early stretch of hot shooting from Washington — and a cold streak of its own. When the teams reverted to something closer to their norms, the Heat gave Washington the bum’s rush. The game was into garbage time by halftime.
I have little good to say about the Wizards after this one. I mean, they got curb-stomped by a team starting someone named (and I’m not making this up) Myron Gardner.
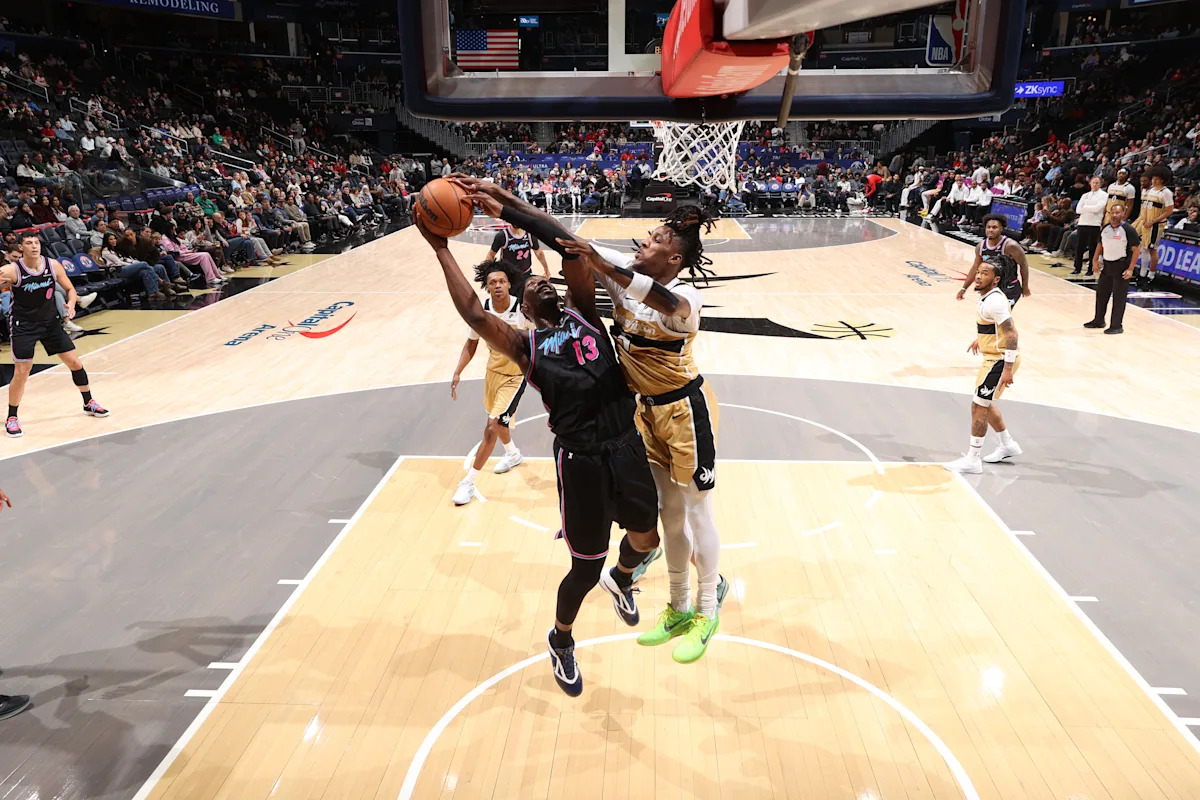
Justin Champagnie drives against the Miami Heat. | NBAE via Getty Images
In fairness, Gardner wasn’t bad. Basketball-Reference claims he attended Georgetown (the one in DC) after first playing for South Plains College (a community college in Texas), and that he also played for Little Rock.
Advertisement
Here are the few Wizards positives:
Justin Champagnie was decent — 3 offensive rebounds and 7 total in 25 minutes.
Alex Sarr tried on the defensive end but was truly on an island all afternoon. He finished with 12 rebounds…and five fouls as he tried to cover for his missing in action teammates.
Coulibaly also tried on the defensive end. He committed four fouls.
Solid game from Jamir Watkins, who scored 12 points, hit a three, and had 7 rebounds, a steal and 2 blocks.
The Wizards committed just 12 fouls in the game. Sarr had five. Coulibaly had four. No one else had more than one. Perhaps this is because a prerequisite for committing a foul is being near the offensive player.
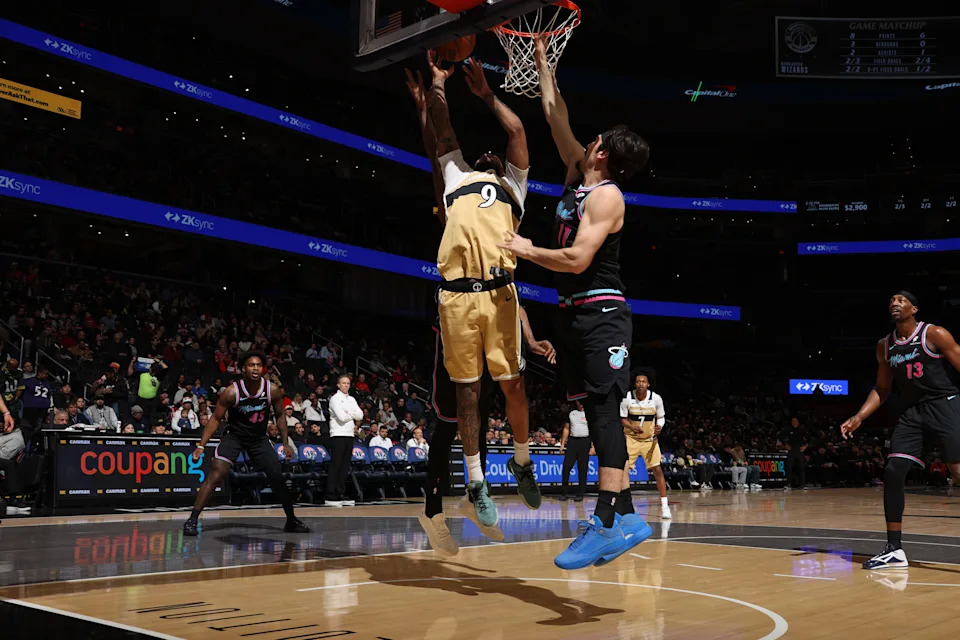
For example, when he wanted to throw down a poster dunk on an offensive rebound, Bam Adebayo had to do it over teammate Kel’el Ware. No Wizards were in the vicinity.
Washington lost in every meaningful way. They got outshot, out-rebounded, committed more turnovers, and made fewer free throws. They got lit up by Kasparas Jakucionis. They got outscored by 41 points in Adabayo’s 28 minutes.That’s a complete drubbing.
This was Washington’s eighth loss of the season by 30 or more points. One of those was a 45-point beatdown by the Boston Celtics.
They have eight more losses by 20 or more points, including a 29-point drubbing by Boston. They have three more defeats by 19 points.
Advertisement
Four Factors
Below are the four factors that decide wins and losses in basketball — shooting (efg), rebounding (offensive rebounds), ball handling (turnovers), fouling (free throws made).
The four factors are measured by:
eFG% (effective field goal percentage, which accounts for the three-point shot)
OREB% (offensive rebound percentage)
TOV% (turnover percentage — turnovers divided by possessions)
FTM/FGA (free throws made divided by field goal attempts)
FOUR FACTORS
HEAT
WIZARDS
LGAVG
eFG%
57.2%
48.4%
54.3%
OREB%
39.6%
20.4%
26.1%
TOV%
15.2%
18.0%
12.7%
FTM/FGA
0.125
0.118
0.208
PACE
106
99.5
ORTG
125
96
115.5
Stats & Metrics
PPA is my overall production metric, which credits players for things they do that help a team win (scoring, rebounding, playmaking, defending) and dings them for things that hurt (missed shots, turnovers, bad defense, fouls).
PPA is a per possession metric designed for larger data sets. In small sample sizes, the numbers can get weird. In PPA, 100 is average, higher is better and replacement level is 45. For a single game, replacement level isn’t much use, and I reiterate the caution about small samples sometimes producing weird results.
Advertisement
POSS is the number of possessions each player was on the floor in this game.
ORTG = offensive rating, which is points produced per individual possessions x 100. League average so far this season is listed in the Four Factors table above. Points produced is not the same as points scored. It includes the value of assists and offensive rebounds, as well as sharing credit when receiving an assist.
USG = offensive usage rate. Average is 20%.
ORTG and USG are versions of stats created by former Wizards assistant coach Dean Oliver and modified by me. ORTG is an efficiency measure that accounts for the value of shooting, offensive rebounds, assists and turnovers. USG includes shooting from the floor and free throw line, offensive rebounds, assists and turnovers.
Advertisement
+PTS = “Plus Points” is a measure of the points gained or lost by each player based on their efficiency in this game compared to league average efficiency on the same number of possessions. A player with an offensive rating (points produced per possession x 100) of 100 who uses 20 possessions would produce 20 points. If the league average efficiency is 115, the league — on average — would produced 23.0 points in the same 20 possessions. So, the player in this hypothetical would have a +PTS score of -3.0.
Players are sorted by total production in the game.
WIZARDS
MIN
POSS
ORTG
USG
+PTS
PPA
+/-
Jamir Watkins
33
74
123
13.9%
0.7
115
-33
Justin Champagnie
25
55
121
20.5%
0.6
120
-8
Tristan Vukcevich
20
44
101
31.4%
-2.0
95
-17
Bub Carrington
29
63
92
22.6%
-3.4
52
-9
Sharife Cooper
20
45
107
17.8%
-0.7
72
-28
Alex Sarr
26
57
94
23.1%
-2.9
50
-5
Kyshawn George
19
42
97
30.6%
-2.4
56
-4
Keshon Gilbert
13
30
99
4.3%
-0.2
20
-21
Will Riley
21
46
64
23.3%
-5.5
-16
-26
Bilal Coulibaly
34
74
62
14.4%
-5.7
-40
-4
HEAT
MIN
POSS
ORTG
USG
+PTS
PPA
+/-
Kasparas Jakucionis
26
57
213
16.6%
9.2
431
27
Bam Adebayo
28
62
134
22.7%
2.7
287
41
Andrew Wiggins
23
52
132
18.0%
1.5
261
1
Kel’el Ware
30
66
153
16.0%
3.9
200
22
Simone Fontecchio
19
42
141
21.2%
2.2
288
33
Myron Gardner
21
46
124
22.1%
0.8
224
0
Norman Powell
25
55
137
23.2%
2.7
182
7
Davion Mitchell
25
55
71
14.0%
-3.4
-26
16
Jaime Jaquez Jr.
24
52
54
31.4%
-9.9
-174
9
Nikola Jovic
6
12
168
22.6%
1.5
369
0
Dru Smith
6
12
103
9.4%
-0.1
125
0
Jahmir Young
8
18
68
17.1%
-1.4
-41
-1