
The Washington Wizards got mauled by the Indiana Pacers, suffering a historic 162-109 beating on the second night of a back-to-back for both teams.
Last night, the Wizards scored 45 points in the first quarter and hung on to beat the Philadelphia 76ers. Tonight, they allowed 45 first-quarter points to the Pacers and then proceeded to allow 38 in the second, 42 in the third, and 37 in the fourth.
It was the worst defensive performance in franchise history. Here are a few of the new “records”:
Most points allowed: 162 — surpassing the 159 scored by the Houston Rockets on Oct. 30, 2019.
Worst defensive rating: 165.6 — previous worst was 153.6 in a March 31, 2008 loss to the Utah Jazz.
Most opponent made threes: 27 — the record was 26 by the Houston Rockets on Dec. 19, 2018. The Pacers also set a new franchise record for made threes. Their previous high was 23.
The 53-point final margin was the largest defeat in franchise history. Their largest previous defeat was by 52 to the Milwaukee Bucks on Jan. 10, 1971.
Most opponent assists: 48 — The previous record was 46 by the Milwaukee Bucks on April 20, 1988.
Highest opponent eFG%: 78.8% — The previous record was 74.2% by the Boston Celtics on April 3, 2022.
Frightening thought: the Pacers did not try to score on their final three possessions.
Bright Spots for the Wizards?
Umm…they had five players on the floor for all 48 minutes?
Hmm…Justin Champagnie scored 15 points on 9 shots.
Colby Jones showed some skills and athleticism (as well as inexperience). He knocked down a couple threes, and had 3 steals.
Jordan Poole wasn’t bad — 18 points on 13 shots, as well as 3 assists and 2 steals. He hit 4-8 from three.
Alex Sarr had some nice offensive moments against Myles Turner.
Fun Stuff in this Game
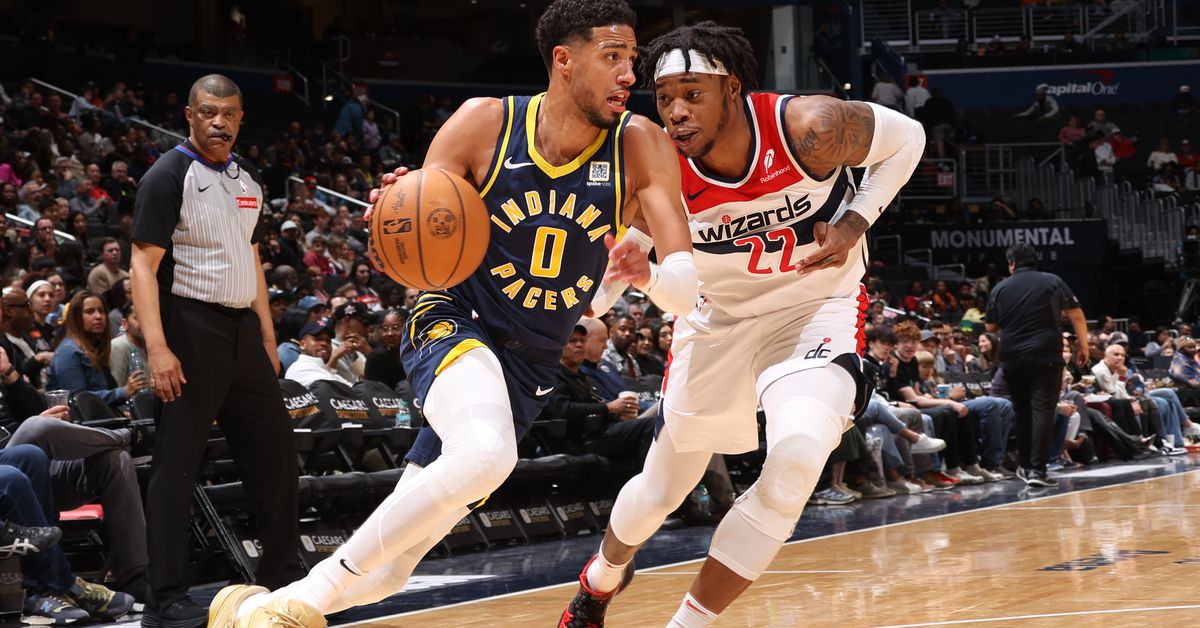
Tyrese Haliburton snapped a string of 12 consecutive games with double-digit points and assists. He TORCHED the Wizards with 29 points on 15 shots in just 25 minutes. He also had 6 assists and just one turnover. By the way, his PPA for the season entering the game was 220.
T.J. McConnell had 10 points, 9 rebounds and 8 assists in 17 minutes.
Former Wizards great Quenton Jackson posted 7 assists and 3 steals in 9 (garbage time) minutes.
Former Wizards great Thomas Bryant had 12 points on 4-5 shooting and 7 rebounds in 13 minutes.
The Pacers tallied 48 assists with no one on the roster producing more than 8.
The Wizards were -28 in 15 minutes with Tristan Vukcevic on the floor.
Four Factors
Below are the four factors that decide wins and losses in basketball — shooting (efg), rebounding (offensive rebounds), ball handling (turnovers), fouling (free throws made).
The four factors are measured by:
eFG% (effective field goal percentage, which accounts for the three-point shot)
OREB% (offensive rebound percentage)
TOV% (turnover percentage — turnovers divided by possessions)
FTM/FGA (free throws made divided by field goal attempts)
In the table below are the four factors using the percentages and rates traditionally presented. There’s also a column showing league average in each of the categories to give a sense of each team’s performance relative to the rest of the league this season.
Four Factors: Pacers at Wizards
FOUR FACTORS
PACERS
WIZARDS
LGAVG
FOUR FACTORS
PACERS
WIZARDS
LGAVG
eFG%
78.8%
51.2%
54.2%
OREB%
40.6%
24.5%
25.2%
TOV%
12.3%
15.3%
12.7%
FTM/FGA
0.185
0.259
0.191
PACE
98
98.9
ORTG
166
111
114.4
Stats & Metrics
Below are a few performance metrics. PPA is my overall production metric, which credits players for things they do that help a team win (scoring, rebounding, playmaking, defending) and dings them for things that hurt (missed shots, turnovers, bad defense, fouls).
PPA is a per possession metric designed for larger data sets. In small sample sizes, the numbers can get weird. In PPA, 100 is average, higher is better and replacement level is 45. For a single game, replacement level isn’t much use, and I reiterate the caution about small samples sometimes producing weird results.
POSS is the number of possessions each player was on the floor in this game.
ORTG = offensive rating, which is points produced per individual possessions x 100. League average last season was 114.8. Points produced is not the same as points scored. It includes the value of assists and offensive rebounds, as well as sharing credit when receiving an assist.
USG = offensive usage rate. Average is 20%.
ORTG and USG are versions of stats created by former Wizards assistant coach Dean Oliver and modified by me. ORTG is an efficiency measure that accounts for the value of shooting, offensive rebounds, assists and turnovers. USG includes shooting from the floor and free throw line, offensive rebounds, assists and turnovers.
+PTS = “Plus Points” is a measure of the points gained or lost by each player based on their efficiency in this game compared to league average efficiency on the same number of possessions. A player with an offensive rating (points produced per possession x 100) of 100 who uses 20 possessions would produce 20 points. If the league average efficiency is 114, the league — on average — would produced 22.8 points in the same 20 possessions. So, the player in this hypothetical would have a +PTS score of -2.8.
Players are sorted by total production in the game.
Stats & Metrics: Wizards
WIZARDS
MIN
POSS
ORTG
USG
+PTS
PPA
+/-
WIZARDS
MIN
POSS
ORTG
USG
+PTS
PPA
+/-
Justin Champagnie
33
68
131
17.4%
1.9
98
-33
Colby Jones
30
60
136
14.1%
1.8
104
-24
Jordan Poole
25
50
122
26.8%
1.0
122
-24
Alex Sarr
28
56
118
32.4%
0.6
84
-27
Bub Carrington
31
62
110
20.0%
-0.6
54
-19
Richaun Holmes
13
27
142
26.4%
2.0
93
-13
Khris Middleton
14
29
116
23.1%
0.1
86
-17
Jaylen Martin
23
46
123
8.7%
0.3
39
-37
Anthony Gill
3
7
204
10.7%
0.7
141
-2
AJ Johnson
27
54
39
10.1%
-4.1
-30
-41
Tristan Vukcevic
15
30
44
32.6%
-6.8
-152
-28
Stats & Metrics: Pacers
PACERS
MIN
POSS
ORTG
USG
+PTS
PPA
+/-
PACERS
MIN
POSS
ORTG
USG
+PTS
PPA
+/-
Tyrese Haliburton
25
51
176
29.4%
9.2
422
29
T.J. McConnell
17
35
167
24.1%
4.4
373
26
Quenton Jackson
9
18
215
21.7%
4.0
710
12
Andrew Nembhard
20
41
187
14.6%
4.4
285
8
Obi Toppin
16
34
187
21.6%
5.2
329
25
Pascal Siakam
23
46
167
17.2%
4.2
225
14
Jarace Walker
25
50
166
18.6%
4.8
202
31
Myles Turner
21
44
184
18.3%
5.6
216
21
Thomas Bryant
14
28
222
16.9%
5.2
302
20
Ben Sheppard
12
24
180
14.3%
2.3
218
16
Aaron Nesmith
19
38
125
18.5%
0.8
115
12
Johnny Furphy
8
16
304
6.0%
1.8
170
11
Tony Bradley
9
19
115
26.9%
0.0
57
10
Bennedict Mathurin
22
44
96
24.2%
-2.0
23
30