
After a couple wins against the cellar-dwelling Indiana Pacers, the Wizards took on a surging Charlotte Hornets and got buried under an avalanche of threes. The Hornets made 25 in the game — one shy of their franchise record. Along the way, Charlotte connected on 12-14 from deep in the third quarter alone.
The Wizards did give up some open and wide-open looks in that ridiculous third quarter, but in fairness that kind of shooting is largely outlier flukish luck. Even All-Star teams going against All-Star level “defense” won’t make 12-14 from three-point range.
Wizards wing Bilal Coulibaly scored 15 points in the first quarter of the team’s loss to the Charlotte Hornets. | NBAE via Getty Images
The Hornets deserve some credit too. Several of those threes came from stellar offensive design — multiple screens and side-switching player movement that befuddled the Wizards and created open looks. While the Wizards made a habit of dying on screens and not communicating effectively on switches, but those actions are tough to cover, and the league as a whole has had difficulty keeping up with them over the past couple months.
Advertisement
Overall, I’d have to say there wasn’t much to learn in this one. Washington was missing several players, head coach Brian Keefe kept the team’s available maintstays on a tight minutes leash, and gave biggest minutes to the two-way and 10-day guys. All part of the Keep That Pick campaign.
Thoughts & Observations
With Alex Sarr and Tristan Vukcevic in street clothes, Anthony Gill got his first start of the season and the 16th start of his career. Nice that it happened against Charlotte, so Hornets play-by-play man Eric Collins could talk about Gill coming from Charlotte.
Kyshawn George played pretty well in his first game back from a toe injury.
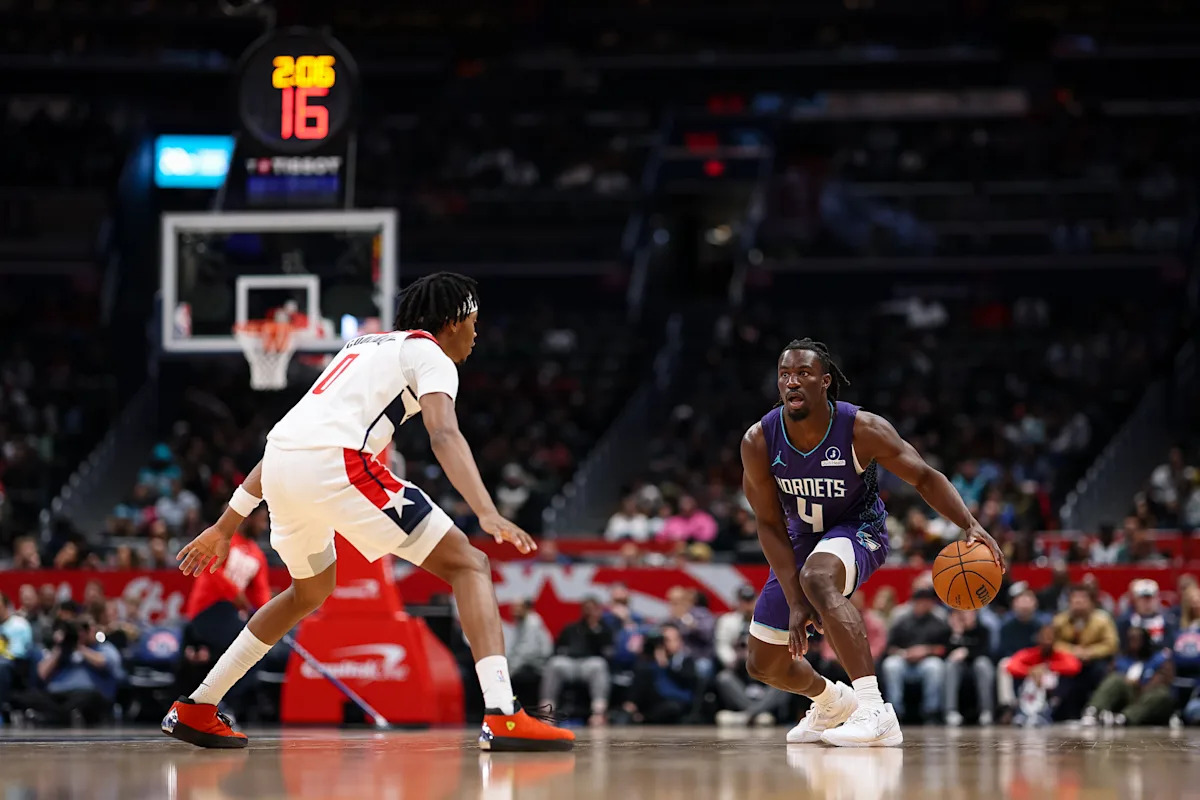
Bilal Coulibaly exhibited shocking offensive aggression (for him) from the opening tip. He scored Washington’s first 11 points, and it was more than three minutes before anyone other Wizards player even attempting a field goal. He finished the period with 15 points — the highest offensive output in a single quarter in his career.
Coulibaly’s previous high for a quarter was 13.
Note I jotted during the first quarter: LaMelo has the weirdest shot in the NBA. It got even weirder later when he hit a contested and fading three off one leg with the shot clock expiring. He hit 10-15 from three-point range.
Kudos to the Wizards defense for holding Ball to 2-5 shooting on twos. (No, this is not a serious observation.)
It’s a little weird to talk about a 33-year-old lacking experience, but I think it might apply to Gill. Example: in the second quarter, he turned down a wide open catch-and-shoot three and instead drove into multiple defenders…and turned it over. The lesson? Take. The. Open. Shot.
After Coulibaly’s personal best first quarter, he got zero minutes in the second and just eight minutes the rest of the game.
The Christian and Scooby halftime show was great. If you haven’t seen the show, Google it. You’re welcome.
I get that the franchise wants to lose so they can keep that first round pick and improve their odds of getting the highest possible draft slot. Even so, why would they start the second half running a postup for Bub Carrington who was being defended by Ball — who’s three inches taller?
Charlotte’s offensive rating (points per possession x 100) through three quarter was 146. League average this season: 115.4.
Charlotte is on a seven-game road winning streak.
Four Factors
Below are the four factors that decide wins and losses in basketball — shooting (efg), rebounding (offensive rebounds), ball handling (turnovers), fouling (free throws made).
The four factors are measured by:
eFG% (effective field goal percentage, which accounts for the three-point shot)
OREB% (offensive rebound percentage)
TOV% (turnover percentage — turnovers divided by possessions)
FTM/FGA (free throws made divided by field goal attempts)
FOUR FACTORS
HORNETS
WIZARDS
LGAVG
eFG%
63.8%
59.5%
54.3%
OREB%
36.4%
19.6%
26.1%
TOV%
13.0%
11.9%
12.8%
FTM/FGA
0.207
0.143
0.208
PACE
92
99.5
ORTG
140
121
115.4
Stats & Metrics
PPA is my overall production metric, which credits players for things they do that help a team win (scoring, rebounding, playmaking, defending) and dings them for things that hurt (missed shots, turnovers, bad defense, fouls).
Advertisement
PPA is a per possession metric designed for larger data sets. In small sample sizes, the numbers can get weird. In PPA, 100 is average, higher is better and replacement level is 45. For a single game, replacement level isn’t much use, and I reiterate the caution about small samples sometimes producing weird results.
POSS is the number of possessions each player was on the floor in this game.
ORTG = offensive rating, which is points produced per individual possessions x 100. League average so far this season is listed in the Four Factors table above. Points produced is not the same as points scored. It includes the value of assists and offensive rebounds, as well as sharing credit when receiving an assist.
USG = offensive usage rate. Average is 20%.
Advertisement
ORTG and USG are versions of stats created by former Wizards assistant coach Dean Oliver and modified by me. ORTG is an efficiency measure that accounts for the value of shooting, offensive rebounds, assists and turnovers. USG includes shooting from the floor and free throw line, offensive rebounds, assists and turnovers.
+PTS = “Plus Points” is a measure of the points gained or lost by each player based on their efficiency in this game compared to league average efficiency on the same number of possessions. A player with an offensive rating (points produced per possession x 100) of 100 who uses 20 possessions would produce 20 points. If the league average efficiency is 115, the league — on average — would produced 23.0 points in the same 20 possessions. So, the player in this hypothetical would have a +PTS score of -3.0.
Players are sorted by total production in the game.
WIZARDS
MIN
POSS
ORTG
USG
+PTS
PPA
+/-
Bilal Coulibaly
17
33
166
28.8%
4.8
329
-6
Jaden Hardy
22
42
156
21.2%
3.6
178
6
Kyshawn George
18
34
137
24.8%
1.8
185
-21
Sharife Cooper
22
42
119
25.8%
0.4
139
4
Jamir Watkins
16
32
136
28.1%
1.8
185
13
Alondes Williams
34
66
132
10.9%
1.2
89
4
Anthony Gill
31
59
126
11.8%
0.8
66
-33
Will Riley
31
59
140
12.3%
1.8
65
-4
Tre Johnson
19
37
91
31.2%
-2.8
2
-21
Bub Carrington
30
58
55
21.5%
-7.5
-81
-27
HORNETS
MIN
POSS
ORTG
USG
+PTS
PPA
+/-
LaMelo Ball
27
53
199
32.2%
14.2
530
20
Kon Knueppel
28
55
135
33.9%
3.7
242
33
Brandon Miller
26
50
145
26.6%
4.0
210
7
Josh Green
23
45
199
12.2%
4.5
234
10
Ryan Kalkbrenner
15
29
204
14.7%
3.8
299
24
Tidjane Salaun
21
40
245
7.9%
4.1
172
-9
Grant Williams
26
49
105
14.4%
-0.7
39
33
Pat Connaughton
11
21
107
11.9%
-0.2
68
-17
Tre Mann
21
39
98
18.0%
-1.2
31
-3
PJ Hall
17
32
71
19.8%
-2.9
-22
-7
Xavier Tillman
4
7
33
26.6%
-1.5
-208
-4
Sion James
21
40
24
13.0%
-4.8
-120
-2