
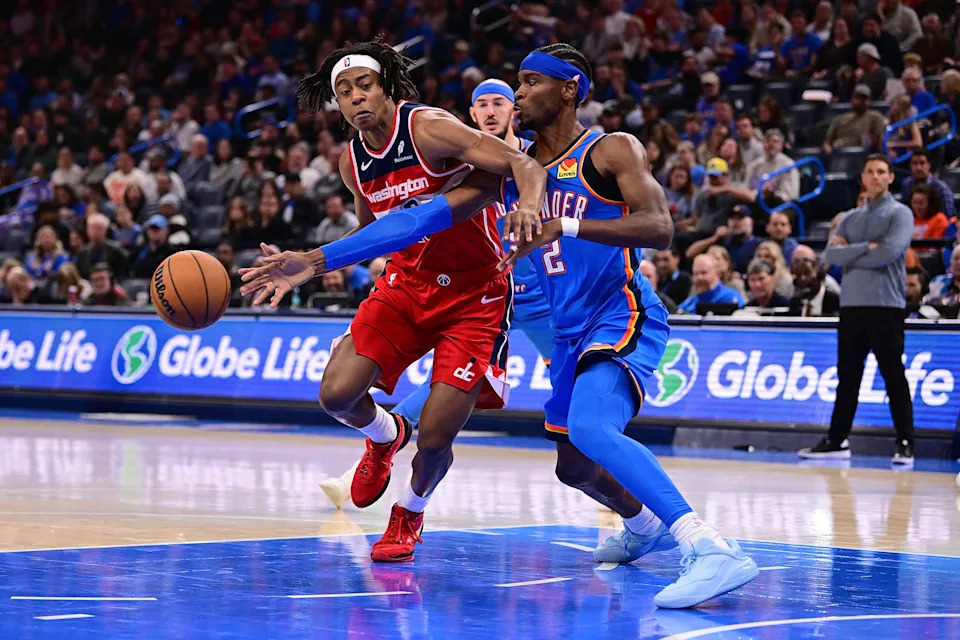
Washington Wizards rookie Tre Johnson gets the ball poked free by Shai Gilgeous-Alexander from the Oklahoma City Thunder.
Last night’s game between the Washington Wizards and the Oklahoma City Thunder was a lesson in NBA reality. The Thunder are the league’s best team. Their odds of repeating as champions are better than Washington’s odds of winning the draft lottery — even if the Wizards finish with the NBA’s worst record.
Advertisement
Even missing their second and third best players (Jalen Williams and Chet Holmgren — in whichever order you prefer) and (perhaps in a related development) bricking probably a dozen wide-open threes, Oklahoma City was playing on an entirely tier than the Wizards.
Where Washington was having defensive breakdowns that left open shooters and gave Thunder players free run at the rim, Oklahoma City was deflecting passes, swarming in help, and forcing Wizards ball handlers into repeated miscues — if the Thunder weren’t just taking the ball away. Related: All of Corey Kispert’s lunch money is now in the hands of Cason Wallace.
Given all that, Washington was still the feisty, competitive, cranky group that’s fun to watch. With 1:34 left to go in the third period, the Wizards cut OKC’s lead to just two points. Things avalanched from there — the Thunder would go up by as much as 24 in the final quarter, and defending league Most Valuable Player did not have to make an appearance in the fourth to close out the win.
In what seems to be a trend for the Wizards this season, they were unable to defend effectively on the perimeter. Gilgeous-Alexander got mostly he wanted on offense — his offensive rating (points produced per individual possession x 100) was dragged down to 153 by some…well, it looked a lot like just kinda messing around. Yes, “dragged down” is facetious. League average so far this season is 115.4. A 153 offensive rating on 31.1% usage is freakish efficiency.
Advertisement
Isaiah Joe feasted on the open threes the Wizards allowed — 5-9 from deep to finish with 20 points in 24 minutes…and a 162 offensive rating. Ajay Mitchell, an 11th man type (at least with the Thunder) getting extended minutes because of the injuries scored 20 in 30 minutes with an offensive rating of 127.
Thoughts & Observations
Kyshawn George had a solid all-around game except for five turnovers and five fouls in 31 minutes. The turnovers were mostly just sloppy ball handling or overly adventurous passing. The fouls are just nonsensical swiping and hacking. Bright side: these flaws are fixable. I’ll take the competitiveness, effort, and the attempts to make plays at this point.
I’m almost to the point of suggesting the Wizards curtail pull up field goal attempts. The thought started percolating watching Bub Carrington try a step-back three that was nowhere close. I’m fine with the team playing fast, but I’d prefer to see them more focused on making plays for each other than hunting their own shots.
Bilal Coulibaly was excellent in his season debut — 16 points (with a decent 113 offensive rating), 8 rebounds, 4 assists, a steal and three blocks. He had some bad moments on defense and some excellent ones too. Probably the stat I liked most: 27.2% usage. I also liked that he confidently stepped into the open three-point shots the Thunder were willing to give him (even though he hit just 2-7).
CJ McCollum had a second straight strong game, at least shooting the ball. I’m not enamored with his non-shooting game (that is to say defense, playmaking, or helping on the boards).
Alex Sarr got pushed around a bit by Isaiah Hartenstein but was still decent. He finished with 14 points, 8 rebounds, and 2 blocks in 26 minutes. His offensive efficiency was reduced by four turnovers.
Corey Kispert helped on the boards and had a couple nice passes to set up teammates. He also got picked twice in the open court by Wallace.
Four Factors
Below are the four factors that decide wins and losses in basketball — shooting (efg), rebounding (offensive rebounds), ball handling (turnovers), fouling (free throws made).
The four factors are measured by:
eFG% (effective field goal percentage, which accounts for the three-point shot)
OREB% (offensive rebound percentage)
TOV% (turnover percentage — turnovers divided by possessions)
FTM/FGA (free throws made divided by field goal attempts)
In the table below are the four factors using the percentages and rates traditionally presented.
FOUR FACTORS
WIZARDS
THUNDER
LGAVG
eFG%
55.4%
53.1%
54.3%
OREB%
26.7%
27.5%
26.4%
TOV%
21.9%
6.0%
13.5%
FTM/FGA
0.179
0.235
0.238
PACE
100
101.1
ORTG
108
127
115.4
Stats & Metrics
PPA is my overall production metric, which credits players for things they do that help a team win (scoring, rebounding, playmaking, defending) and dings them for things that hurt (missed shots, turnovers, bad defense, fouls).
Advertisement
PPA is a per possession metric designed for larger data sets. In small sample sizes, the numbers can get weird. In PPA, 100 is average, higher is better and replacement level is 45. For a single game, replacement level isn’t much use, and I reiterate the caution about small samples sometimes producing weird results.
POSS is the number of possessions each player was on the floor in this game.
ORTG = offensive rating, which is points produced per individual possessions x 100. League average so far this season is 115.1. Points produced is not the same as points scored. It includes the value of assists and offensive rebounds, as well as sharing credit when receiving an assist.
USG = offensive usage rate. Average is 20%.
Advertisement
ORTG and USG are versions of stats created by former Wizards assistant coach Dean Oliver and modified by me. ORTG is an efficiency measure that accounts for the value of shooting, offensive rebounds, assists and turnovers. USG includes shooting from the floor and free throw line, offensive rebounds, assists and turnovers.
+PTS = “Plus Points” is a measure of the points gained or lost by each player based on their efficiency in this game compared to league average efficiency on the same number of possessions. A player with an offensive rating (points produced per possession x 100) of 100 who uses 20 possessions would produce 20 points. If the league average efficiency is 114, the league — on average — would produced 22.8 points in the same 20 possessions. So, the player in this hypothetical would have a +PTS score of -2.8.
Players are sorted by total production in the game.
WIZARDS
MIN
POSS
ORTG
USG
+PTS
PPA
+/-
Bilal Coulibaly
24
51
113
27.2%
-0.3
201
-12
CJ McCollum
24
50
165
18.8%
4.7
192
-5
Alex Sarr
26
54
101
26.0%
-2.1
90
-8
Kyshawn George
31
64
106
20.4%
-1.3
53
-14
Marvin Bagley III
16
34
152
17.1%
2.1
98
-7
Cam Whitmore
15
32
97
23.3%
-1.3
93
-8
Corey Kispert
20
41
104
20.6%
-1.0
61
-12
Tre Johnson
27
56
125
13.4%
0.7
39
-2
Khris Middleton
20
41
89
17.4%
-1.9
-43
-19
Bub Carrington
22
46
41
16.9%
-5.8
-140
-11
Tristan Vukcevic
4
8
147
28.1%
0.7
190
1
Will Riley
5
10
124
16.9%
0.1
89
0
Justin Champagnie
4
8
63
12.5%
-0.5
0
1
AJ Johnson
4
8
0
9.6%
-0.8
-114
1
THUNDER
MIN
POSS
ORTG
USG
+PTS
PPA
+/-
Shai Gilgeous-Alexander
29
61
153
31.1%
7.1
338
8
Cason Wallace
27
57
160
13.7%
3.5
278
14
Isaiah Joe
24
50
162
20.1%
4.8
302
11
Isaiah Hartenstein
26
54
129
28.2%
2.0
209
15
Luguentz Dort
26
54
135
12.2%
1.3
193
16
Ajay Mitchell
30
63
127
22.3%
1.6
136
9
Jaylin Williams
22
46
137
14.5%
1.4
166
4
Alex Caruso
17
35
24
14.7%
-4.7
-6
11
Chris Youngblood
6
12
0
6.1%
-0.8
-48
8
Aaron Wiggins
24
51
67
24.5%
-6.1
-36
3
Branden Carlsen
4
8
293
12.7%
1.7
443
-1
Ousmane Dieng
5
11
101
12.9%
-0.2
82
-3