
The Washington Wizards visited the Charlotte Hornets with a better than theoretical chance of emerging with a win, and they kept things close for much of the night. And then, they got avalanched in the final period to lose, 126-109.
While the Wizards led by as much as 10 early in the second quarter, it never felt like they were causing the scoring differential. The Hornets got open looks, which they missed. Charlotte was just 3-14 (21.4%) from three in the first quarter, but the Wizards defense was causing little stress. It was a case of the other guy just missing, and it felt like the tide would turn when the shots dropped at a more normal rate.
Wizards big man Alex Sarr rejects a Kon Knueppel layup attempt.
In the second quarter, Charlotte began to assert itself, primarily due the offensive rebounding exploits of Moussa Diabate. He finished the game with a career-high 18 rebounds, 8 on the offensive glass.
Advertisement
In the first half, the Wizards allowed the Hornets an offensive rating (points scored per possession x 100) of 129 — an astounding number considering Charlotte’s poor shooting (48.1% effective field goal percentage). The Wizards made that possible by giving up so many offensive rebounds and their (continued) inability to force turnovers. Charlotte had just two in the first half.
And no, this isn’t a case where the Hornets are really good at avoiding turnovers. They entered the game 26th in offensive turnover percentage. To put it simply, Wizards defenders do not stress opposing ball handlers in any meaningful way.
After their poor start from the floor, the Hornets ended the game with an eFG% of 55.9%. The Wizards? Just 46.4%. Washington still managed above average efficiency because they grabbed 18 offensive rebounds and committed just six turnovers.
Still, the inability to defend effectively and gather defensive boards send the Wizards to another defeat and lowers their record to 5-23.
Advertisement
Thoughts & Observations
One positive moment in the first half was some defensive communication between Kyshawn George and Marvin Bagley III. Charlotte ran an action that had the two inverted — Bagley defending on the wing and George in the middle. They called it out to each other and switched seamlessly while Charlotte was getting organized out top.
Not so positive: the Wizards switched to zone late in the first quarter, and the Hornets shredded it.
Bilal Coulibaly led the Wizards with 11 points in the first half on 4-8 shooting. He’d finish with 14 points, including 3-9 from three.
The Hornets clearly were willing to concede threes to Coulibaly.
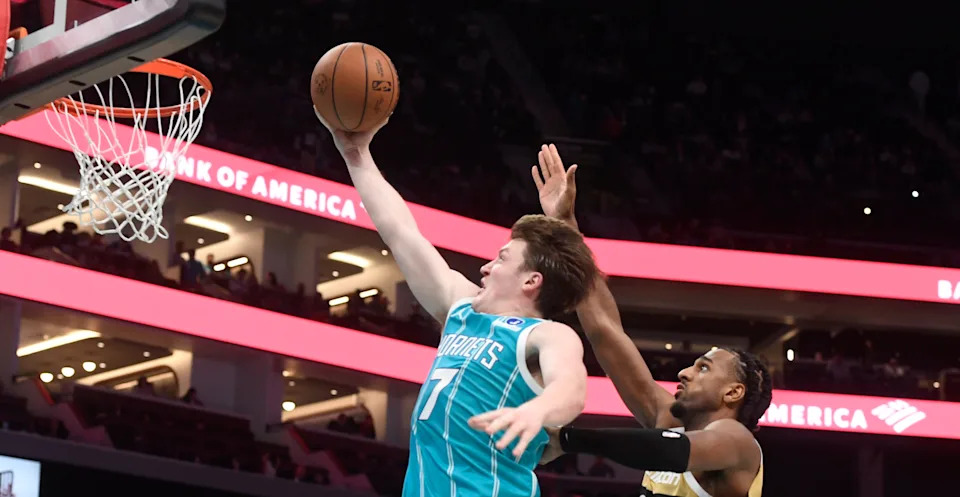
Washington’s highlight of the night: Alex Sarr got switched onto Knueppel and was immediately administered a blow-by drive. Knueppel got to the rim and laid it up only for Sarr to block the shot off the backboard. It should be on the NBA’s Top 10 Plays rundown tomorrow.
Add Dell Curry to the (long) list of opposing team commentators who marvel at the Wizards’ shot selection — and not in a good way.
Miserable night for Kyshawn George, who scored just 2 points on 1-9 shooting and committed three turnovers. He was fortunate to not be ejected for a reckless foul he committed in the first quarter on LaMelo Ball. Playing physical is good. Fouling when you’ve been beaten isn’t necessarily a bad thing. Knocking a guy into the first row? Uncalled for.
Khris Middleton can still get buckets. The reason he won’t fetch a trade return from a contending team is that he’s a defensive sieve.
Corey Kispert returned to action for the first time since fracturing the tip of his thumb almost a month ago. He looked about the same as he did before the injury, which isn’t bad.
When Justin Champagnie enters the game, the Wizards start getting rebounds.
Coulibaly had a 25.5% usage rate. At one point, he has hollering at McCollum for a kickout pass. McCollum took the shot.
Bub Carrington committed three fouls in his first three minutes of action. He finished with four fouls in 15 minutes.
Four Factors
Below are the four factors that decide wins and losses in basketball — shooting (efg), rebounding (offensive rebounds), ball handling (turnovers), fouling (free throws made).
The four factors are measured by:
eFG% (effective field goal percentage, which accounts for the three-point shot)
OREB% (offensive rebound percentage)
TOV% (turnover percentage — turnovers divided by possessions)
FTM/FGA (free throws made divided by field goal attempts)
FOUR FACTORS
WIZARDS
HORNETS
LGAVG
eFG%
46.4%
55.9%
54.3%
OREB%
32.7%
31.1%
26.3%
TOV%
6.4%
4.3%
13.0%
FTM/FGA
0.196
0.237
0.218
PACE
93
100.1
ORTG
117
135
115.6
Stats & Metrics
PPA is my overall production metric, which credits players for things they do that help a team win (scoring, rebounding, playmaking, defending) and dings them for things that hurt (missed shots, turnovers, bad defense, fouls).
PPA is a per possession metric designed for larger data sets. In small sample sizes, the numbers can get weird. In PPA, 100 is average, higher is better and replacement level is 45. For a single game, replacement level isn’t much use, and I reiterate the caution about small samples sometimes producing weird results.
Advertisement
POSS is the number of possessions each player was on the floor in this game.
ORTG = offensive rating, which is points produced per individual possessions x 100. League average so far this season is 115.1. Points produced is not the same as points scored. It includes the value of assists and offensive rebounds, as well as sharing credit when receiving an assist.
USG = offensive usage rate. Average is 20%.
ORTG and USG are versions of stats created by former Wizards assistant coach Dean Oliver and modified by me. ORTG is an efficiency measure that accounts for the value of shooting, offensive rebounds, assists and turnovers. USG includes shooting from the floor and free throw line, offensive rebounds, assists and turnovers.
Advertisement
+PTS = “Plus Points” is a measure of the points gained or lost by each player based on their efficiency in this game compared to league average efficiency on the same number of possessions. A player with an offensive rating (points produced per possession x 100) of 100 who uses 20 possessions would produce 20 points. If the league average efficiency is 114, the league — on average — would produced 22.8 points in the same 20 possessions. So, the player in this hypothetical would have a +PTS score of -2.8.
Players are sorted by total production in the game.
WIZARDS
MIN
POSS
ORTG
USG
+PTS
PPA
+/-
Marvin Bagley III
21
41
173
19.8%
4.7
171
-5
Justin Champagnie
19
38
169
16.1%
3.2
167
-7
Alex Sarr
25
48
126
14.8%
0.8
129
-11
Khris Middleton
22
43
146
22.0%
2.8
137
-12
Tre Johnson
21
42
116
21.9%
0.0
132
10
Bilal Coulibaly
23
46
106
25.5%
-1.1
100
-11
Bub Carrington
15
30
165
12.8%
1.9
111
-4
CJ McCollum
33
65
95
22.8%
-3.1
37
-17
Corey Kispert
13
26
125
27.4%
0.7
83
3
Will Riley
2
4
104
31.8%
-0.2
56
-1
Malaki Branham
6
11
94
25.2%
-0.6
2
-7
Tristan Vukcevic
2
4
0.0%
0.0
0
-1
Anthony Gill
2
4
0.0%
0.0
0
-1
AJ Johnson
2
4
0
15.9%
-0.8
-180
-1
Kyshawn George
31
61
52
17.8%
-6.9
-84
-20
HORNETS
MIN
POSS
ORTG
USG
+PTS
PPA
+/-
LaMelo Ball
25
48
154
31.3%
5.8
318
20
Moussa Diabate
36
70
217
9.2%
6.5
211
38
Sion James
24
46
182
18.6%
5.7
249
-7
Brandon Miller
30
59
129
22.1%
1.8
183
32
Collin Sexton
16
31
147
26.3%
2.6
221
9
Kon Knueppel
28
55
116
23.4%
0.0
107
13
Tidjane Salaun
22
42
101
22.7%
-1.4
113
-9
Josh Green
11
22
185
9.7%
1.5
180
-6
Miles Bridges
34
65
97
20.2%
-2.4
45
6
Pat Connaughton
1
3
0.0%
0.0
0
-2
Liam McNeeley
1
3
0.0%
0.0
0
-2
Tre Mann
12
23
73
16.7%
-1.6
-51
-7